Profiling an ASP.NET application on web development server
Published 14 May 2018
To profile ASP.NET applications running on the web development server:
- Start ANTS Memory Profiler and click

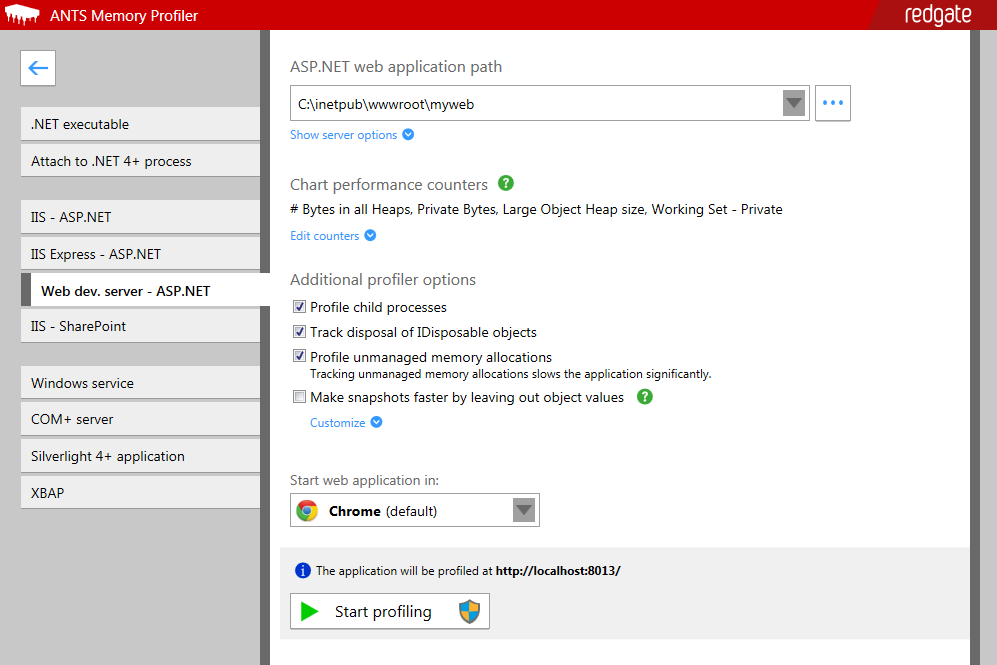
- From the list of application types, select Web dev. server - ASP.NET.
- Under ASP.NET web application path, enter the path to your application.
- If you want to specify a port, virtual directory, or start page for your application, click Show server options:
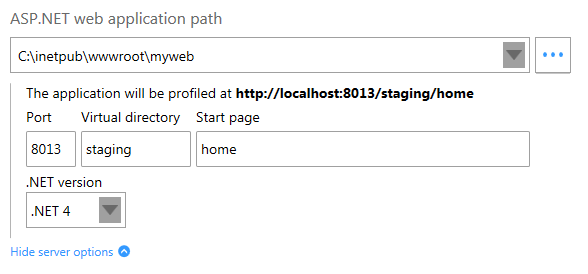
If your application doesn't run on .NET 4, select .NET 2 from the .NET version drop-down list. - If you want to record extra performance counters, click Edit counters and select the counters you want.
Move your mouse pointer over a performance counter to read more about it.
For more information about performance counters, see Setting up performance counters. - Under Additional profiler options:
- Select Profile child processes to include any processes created by your application in profiling.
If your application has lots of child processes, this option will slow down your application. - Select Track disposal of IDisposable objects to keep track of when IDisposable objects in your application are disposed.
This option will slow down your application slightly. Select Profile unmanaged memory allocations if your application access unmanaged memory through P/Invoke or COM+, and you want to profile the unmanaged memory that your application uses.
(Not available in Windows XP / Server 2003 and earlier, or when profiling .NET 1.1 applications.)This option will slow down your application by up to fifty percent, because a lot of additional information is being tracked.
- Select Make snapshots faster by leaving out object values if you've had problems with snapshots being too slow or too large.
You won't be able to see the values of individual instances, but references between objects aren't affected.
If you want to see the values of strings or the contents of arrays specifically, click Customize and deselect the relevant option.
- Select Profile child processes to include any processes created by your application in profiling.
- Click

The main profiling window is displayed, and your application opens in the browser you selected.
On the timeline, you can see the memory being used by your program, along with any other performance counters you selected. - When your application is in a stable state (ie is fully started up and ready for normal use), click
A memory snapshot gives you a detailed breakdown of the memory being used at that point in time, so that you can compare it with later snapshots. - When you've taken at least two snapshots, you can start to investigate your application's memory usage. See Strategies for memory profiling.


