Profiling an ASP.NET Core application on IIS Express
Published 20 November 2020
To profile ASP.NET Core applications running on IIS Express:
Option 1: Manually selecting application to profile
If your application is not available via the applicationhost.config file, you can configure it manually.
- Start ANTS Memory Profiler and click

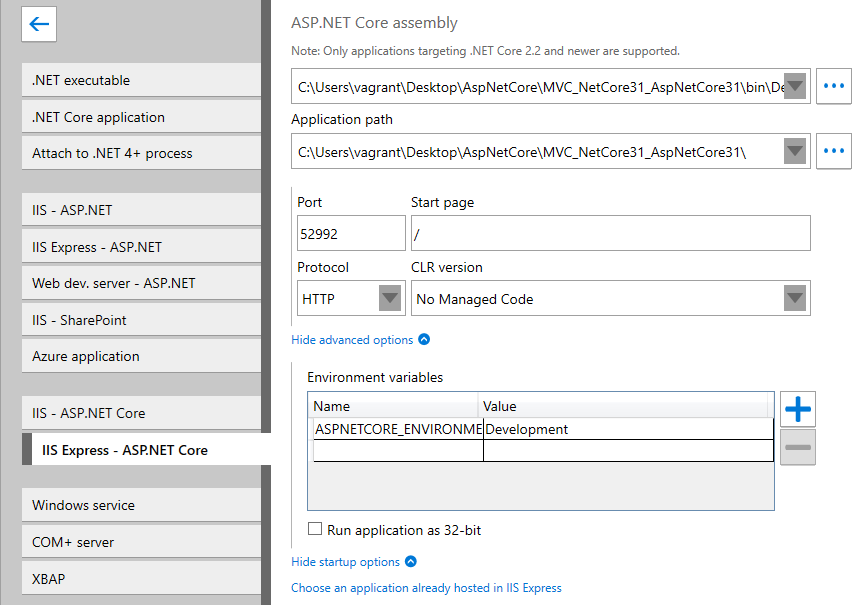
- From the list of application types, select IIS Express - ASP.NET Core.
- Provide a path to your web application's assembly file (.dll or .exe) in the ASP.NET Core assembly field.
Provide a path to your web application's working directory in the Application path field. For published applications this is usually the same directory where the assembly file is located. For debug builds this is usually your project directory.
If the Application path field is not visible, click Profile an application not shown in this list.
- If required, you can set the Port, Protocol, Start page, and preferred CLR version by clicking Show advanced options, or set Environment variables and run the app as 32-bit by clicking Show startup options:
- If you want to record extra performance counters, click Edit counters and select the counters you want.
Move your mouse pointer over a performance counter to read more about it.
For more information about performance counters, see Setting up performance counters. - Under Additional profiler options:
- Select Profile child processes to include any processes created by your application in profiling.
If your application has lots of child processes, this option will slow down your application. - Select Track disposal of IDisposable objects to keep track of when IDisposable objects in your application are disposed.
This option will slow down your application slightly. Select Profile unmanaged memory allocations if your application access unmanaged memory through P/Invoke or COM+, and you want to profile the unmanaged memory that your application uses.
(Not available in Windows XP / Server 2003 and earlier, or when profiling .NET 1.1 applications.)This option will slow down your application by up to fifty percent, because a lot of additional information is being tracked.
- Select Make snapshots faster by leaving out object values if you've had problems with snapshots being too slow or too large.
You won't be able to see the values of individual instances, but references between objects aren't affected.
If you want to see the values of strings or the contents of arrays specifically, click Customize and deselect the relevant option.
- Select Profile child processes to include any processes created by your application in profiling.
Click

Option 2: Profiling applications already configured in applicationhost.config file
You can profile websites already installed to your default applicationhost.config file or provide the path to your own configuration file.
- Start ANTS Memory Profiler and click
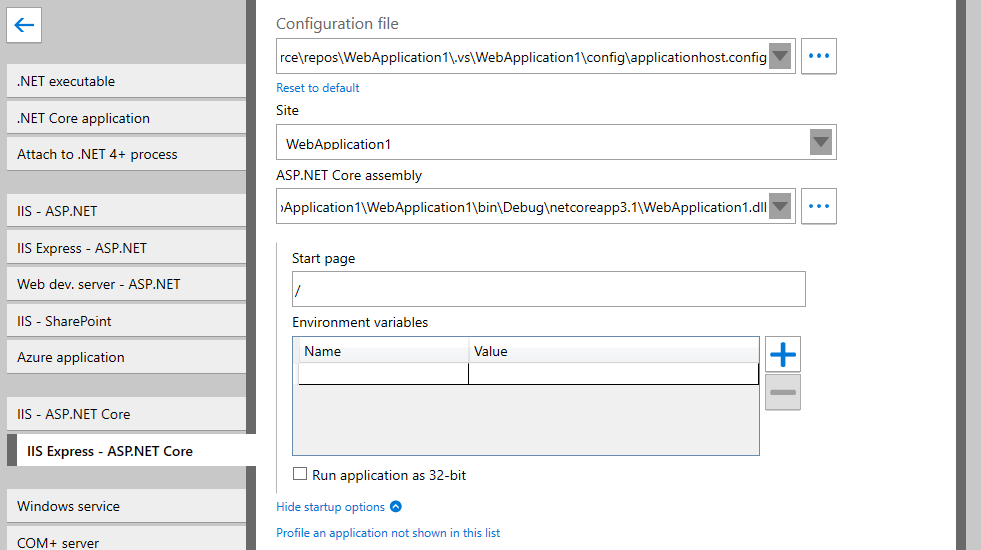
- From the list of application types, select IIS Express - ASP.NET Core.
Confirm that a correct path to applicationhost.config file is provided in the Configuration file field.
If you want to profile a previously debugged website, you can use a config file generated by Visual Studio. This file is usually located in a hidden .vs directory in your solution folder, e.g. C:\SolutionDirectory\.vs\SolutionName\config\applicationhost.config.If the Configuration file field is not visible, click Choose an application already hosted in IIS Express.
When the configuration file is selected, ANTS Memory Profiler will list all available applications in a Site dropdown list. Select a desired application from the list.
If no websites are visible on the list you may need to provide the site's details manually (see Option 1).
- Depending on the information contained in the applicationhost.config file, ANTS Memory Profiler will attempt to automatically fill-in the ASP.NET Core assembly field.
If the ASP.NET Core assembly field remains empty, you must manually locate the assembly file (.dll or .exe) of your web application. - If required, you can set the Start page, Environment variables, and run the app as 32-bit by clicking Show startup options:
- If you want to record extra performance counters, click Edit counters and select the counters you want.
Move your mouse pointer over a performance counter to read more about it.
For more information about performance counters, see Setting up performance counters. - Under Additional profiler options:
- Select Profile child processes to include any processes created by your application in profiling.
If your application has lots of child processes, this option will slow down your application. - Select Track disposal of IDisposable objects to keep track of when IDisposable objects in your application are disposed.
This option will slow down your application slightly. Select Profile unmanaged memory allocations if your application access unmanaged memory through P/Invoke or COM+, and you want to profile the unmanaged memory that your application uses.
(Not available in Windows XP / Server 2003 and earlier, or when profiling .NET 1.1 applications.)This option will slow down your application by up to fifty percent, because a lot of additional information is being tracked.
- Select Make snapshots faster by leaving out object values if you've had problems with snapshots being too slow or too large.
You won't be able to see the values of individual instances, but references between objects aren't affected.
If you want to see the values of strings or the contents of arrays specifically, click Customize and deselect the relevant option.
- Select Profile child processes to include any processes created by your application in profiling.
Click
The main profiling window is displayed, IIS Express starts, and your application opens in the browser you selected.
On the timeline, you can see the memory being used by your program, along with any other performance counters you selected.
- When your application is in a stable state (ie is fully started up and ready for normal use), click
A memory snapshot gives you a detailed breakdown of the memory being used at that point in time, so that you can compare it with later snapshots. - When you've taken at least two snapshots, you can start to investigate your application's memory usage. See Strategies for memory profiling.


