The timeline
Published 14 May 2018
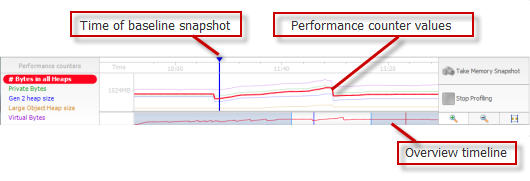
The timeline shows performance counter values for the application you are profiling. Use the timeline to see how much memory your application is using, and to help you decide when to take snapshots.

If you want to change which Windows performance counters are shown, see Setting up performance counters.
The timeline is not shown when analyzing memory dumps.
Snapshots
During a profiling session, click Take Memory Snapshot to record your application's memory usage at that moment.
Taking a snapshot calls the GC.Collect method, which runs the .NET garbage collector. ANTS Memory Profiler then collects information about the objects that survive the garbage collection. For more information, see the .NET memory management primer.
Select the snapshot that you are interested in as the Current snapshot, and select a snapshot to compare it with as the Baseline snapshot.
You can name a snapshot to make it easier to identify. To name a snapshot, click  next to its name, and type the new name, followed by the Enter key. The name is shown on the snapshot's tooltip and in the Baseline / Current drop-down menus beneath the timeline.
Adjusting the time scale
You can change the time scale to view performance counter data in more or less detail by using the mouse wheel, or by using the zoom in  , zoom out
  , and zoom to fit
  buttons. You can also use the keyboard shortcuts: CTRL+PLUS to zoom in; CTRL+MINUS to zoom out.
To pan the main timeline, move the mouse pointer over the highlighted area in the overview timeline ( ), and drag to the left or right.
Troubleshooting the timeline
Counter values may be different from those shown in Performance Monitor or Windows Task Manager, because there are different ways of counting memory usage. For more information, see Setting up performance counters.
If you're attaching to a process and you can't see some performance counters on the timeline, it could be because you haven't disabled concurrent garbage collection. See Disabling concurrent garbage collection.
If you're profiling a Silverlight application, the heap size counters are not displayed on the timeline. This is due to a limitation in Silverlight. Click the Session Overview tab to show these values.
If you aren't profiling a Silverlight application, and you can't see the performance counters on the timeline, you may need to rebuild your performance counters.


