Profiling web requests (HTTP requests)
Published 14 May 2018
Web request profiling is only available in ANTS Performance Profiler Professional edition.
The profiler collects information on the HTTP requests made to your application (for example from a browser) and made by your application (for example to a web service).
This helps give you a fuller picture of how web applications perform, particularly as it is increasingly common for web apps to consume data from web services.
For example, an application that shows data aggregated from a number of other websites via their APIs might perform slowly if it makes unnecessary repeated calls to one of those APIs, or calls them in a subtly wrong way. Web request profiling helps isolate these bottlenecks, so you can see whether an issue is caused by your code, a third-party API or service, or in how your code uses one of those services.
The profiler divides web requests into Requests from client and Outgoing HTTP requests:
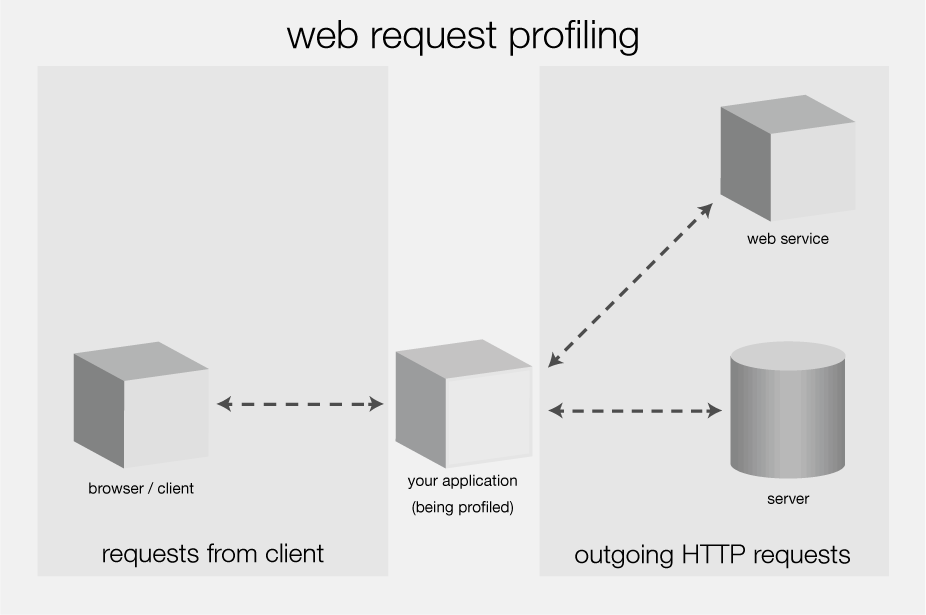
For requests from client you can see:
- The URL requested by the server.
- The total time spent (in milliseconds) generating all pages with this URL.
- The average time (in milliseconds) spent generating pages with this URL.
The hit count (number of times a URL was requested)
For more information, see The HTTP Requests from client view.
For outgoing HTTP requests, you can see:
- The HTTP method your application requested.
GET and POST methods are displayed. All other types of HTTP methods are displayed as 'OTHER'. - The URL requested by your application.
- Whether the request was successful.
- The time (in milliseconds) taken to receive a response to the outgoing HTTP request.
For more information, see The Outgoing HTTP Requests view.
Web request profiling information is collected automatically when you profile an application running on IIS, IIS Express, Web development Server, or a SharePoint application. You don't need to set it up.


