Setting up chart performance counters
Published 14 May 2018
You can monitor the values of a number of built-in Windows performance counters while the application you are profiling is executing. The values of these counters are constantly updated on the timeline while you profile. The counters are grouped into: Processor, .NET, Memory, and IO.
You can also create and add your own custom performance counters.
You can edit chart performance counters only in ANTS Performance Profiler Professional edition.
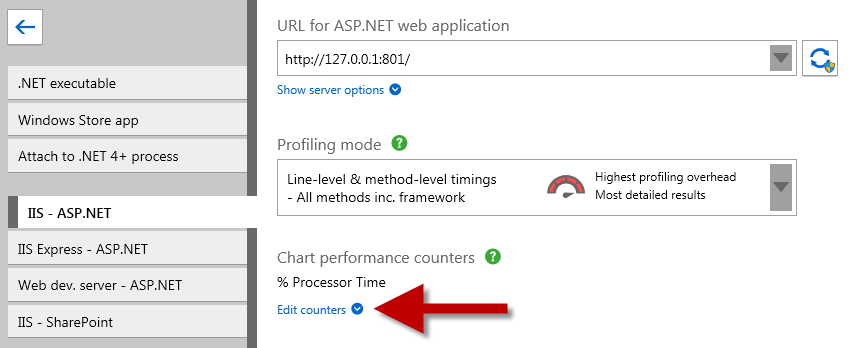
You choose performance counters for each profiling session, in the settings for each application type.
By default, only % Processor time is selected, but you can choose more from the drop-down:
A full set of performance counters is then displayed:
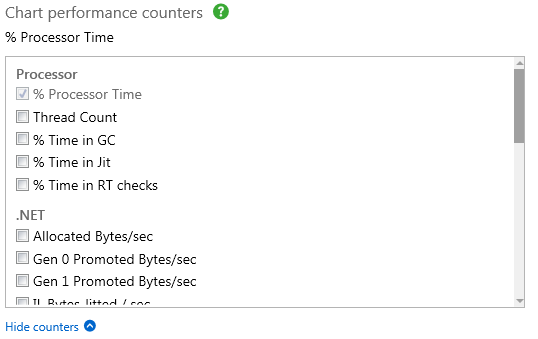
Not all performance counters will necessarily be appropriate to the application you're profiling. By moving the pointer over each counter, you can find more information about individual performance counters, including details about a counter's relevance to particular application types.
Choosing performance counters
Your choice of counters depends on your requirements, and to avoid excessive performance impact it is better to choose just a few appropriate counters.
For example, you might choose:
From the .NET group:
- The Gen 0 Promoted Bytes/sec counter.
This will give the rate at which the garbage collector promotes objects from Generation 0 to Generation 1.
From the Memory group:
- The Working Set counter.
This shows the total amount of physical memory used by your service (including memory used by shared DLLs and the .NET runtime itself)
From the Processor group
- The % Processor Time counter (selected by default).
This shows the percentage of time which all running threads use on the CPU. - The % Time in GC counter.
This shows the percentage of time which the process was suspended to allow the last garbage collection to take place.
We recommend you avoid adding more performance counters than you need, as each additional counter that is recorded adds to the overhead introduced by the profiler.
Adding more than about six counters slows your application substantially.
Adding custom performance counters
You can create custom counters using the Performance Counter API, and add them to the list in the profiler by defining a simple XML file.
To add a custom counter:
- Close ANTS Performance Profiler.
- Expose your performance counter to the Windows Performance Counter API using the
PerformanceCounterandPerformanceCounterCategoryclasses of theSystem.Diagnosticsnamespace.
An example describing how to do this is given at http://msdn.microsoft.com/en-us/library/system.diagnostics.performancecounter.aspx Create a new XML file as follows:
<Counters>
    <Category Name="CategoryName">
      <Counter Category="CategoryName" Name="CounterName" Units="Measurement Units">
         <Instanced />
      </Counter>
   </Category>
</Counters>
Ensure that CategoryName and CounterName are the same as the names used for the PerformanceCounterCategoryand PerformanceCounter. Remove the
<Instanced />node if your counter collects data about the computer, not only the individual process. You can add multiple categories and counters in the same XML file.- Save the XML file as UserCounters.xml in %LOCALAPPDATA%\Red Gate\ANTS Performance Profiler 8\.
- Restart ANTS Performance Profiler.
The counters that you defined are shown in the list on the Chart performance counters menu.


