Async in the call tree
Published 14 May 2018
The call tree's async mode currently only supports async in C#5. Async in VB11 is not currently supported, and so the state machine is always shown.
Async was introduced in C#5. It's primarily designed to solve problems like GUI responsiveness, particularly for web apps and touch-based devices.
The new Async and Await keywords make setting up asynchronous Tasks easier. Tasks being awaited can happen on separate threads, and the state machine implementation is done by the compiler, so applications can stay responsive while Async methods wait for their continuation.
For more detailed information on how Async works and is implemented, see Understanding async code in C#5
Async mode
The profiler offers two approaches to understanding the performance of Async code. It lets you look at the Async as implemented by the CLR, or at a somewhat simplified view where the components of an Async operation are grouped to reflect the code as you logically wrote it.
In this simpler Async Mode it is easier to follow control flow.
For example, here's a trivial example Async method:
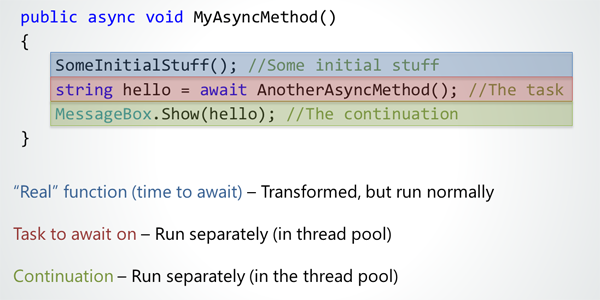
The profiler breaks down the timings as:
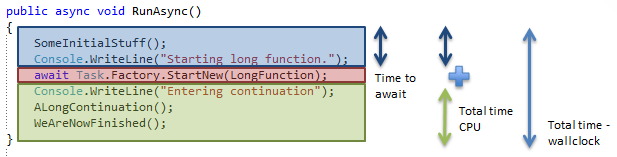
Total time in the CPU time view excludes the time taken to perform the awaited task, whereas total wallclock time includes all time taken for the method to complete.
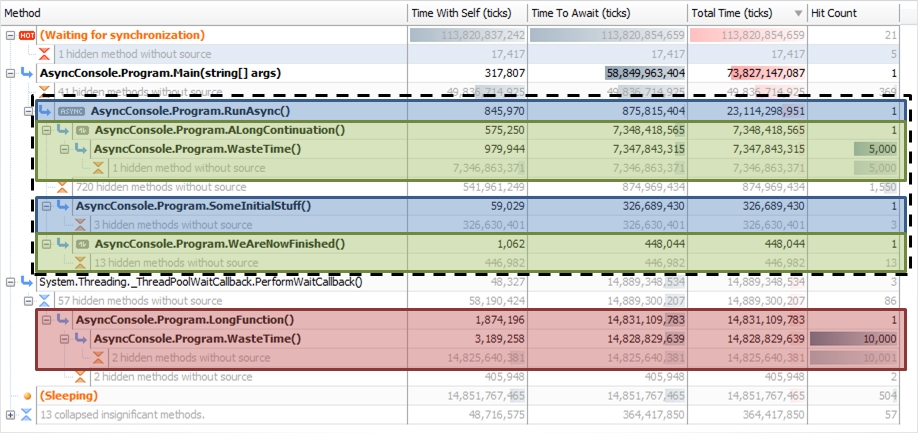
The method is then shown with these timings in the call tree:
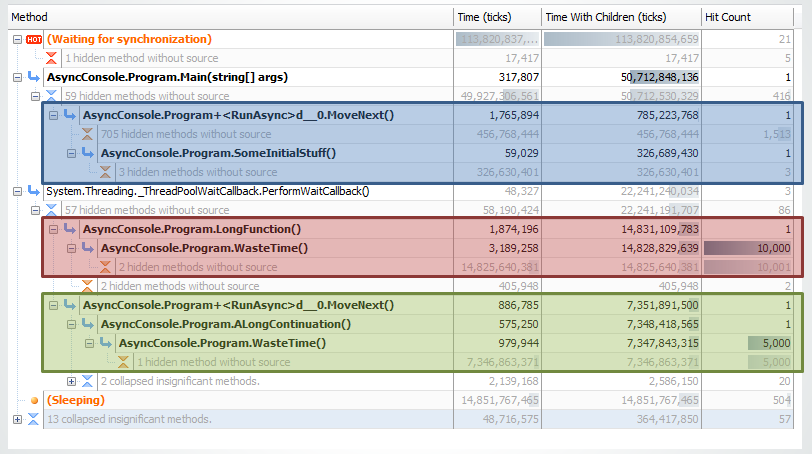
When you mark a method with Async, the compiler implements a state machine that runs all the code in that method. The body of the method itself is replaced by the state machine. As a result, everything except the work being done asynchronously runs inside a MoveNext statement.
Further MoveNext calls corresponding to continuations of an async method may appear elsewhere; these are shown on the call tree.
The profiler then pulls all of these methods back together and merges them under the original method, to give a more logical view.
Async Mode is shown in the call tree by default, and you can deselect it (on the View menu) to see the code as it actually ran:
Async Mode is not available in the call graph.
Total Time in Async
Note that in the Wallclock Time view Total time includes all time spent waiting for awaiting tasks to complete and time spent running continuations. It is not the time taken to perform the awaiting tasks. The difference is most important in cases where multiple awaited tasks are performed in parallel. This is discussed in more detail at the end of this article.
To make the Async flow easier to follow, by default the profiler shows results in Async Mode, and shows only Methods with source. This hides all of the compiler operations that implement the Async state machines, and groups the Async methods.
Where methods were called as continuations of an async method, they're shown with a ![]() icon.
icon.
Interpreting async results in the call tree
Profiling async code is inherently quite complicated. For instance, the difference between the time taken for an awaited task to complete, and the time spent performing it means that results have potential to be confusing, especially when looking at Wallclock time.
It may help to consider that the profiler is effectively viewing the world from the point of view of the method making the asynchronous call. That method doesn't really know anything about the work being done on the awaited thread, it only knows how long the results take to come back.
This means that the call tree could show you a longer Total time (wallclock) for a method than the sum of the actual time taken for method, tasks, and continuation to execute.
This can occur, for example, if more tasks are started than there are threads available. The tasks would have to wait for threads to become available in the thread pool before they could all be completed. The profiler would include all of this time in the Total time (wallclock) not just the time taken to actually perform the task. From the perspective of the method awaiting the task completion, this is an accurate representation of the tine taken to get a result. But from the perspective of the awaited task, it isn't an accurate representation of the time taken to do the work.
Similarly, if a lot of tasks ran in parallel and returned at the same time, then from the method's perspective the total time would be far shorted than the aggregate time taken to do all the work.
In the CPU time view, Total time includes time spent in continuations, because this is processing work being done. But it does not include time spent waiting on async task completion, because this waiting time is not work being done.
Example diagnostics for async performance problems:
Consider the simple example of a UI component like a button that asynchronously fetches some information from the web. It has code in the continuation that processes the data, and displays it somehow. If the application is performing slowly, there are some patterns you could look out for in the call tree:
- Methods with a long Time to Await
Something may blocking the UI thread for too long. You could consider trying to make this work more asynchronous. - An Async method shows long Total Time in the Wallclock time view, but not in CPU time
The application may be spending a long time waiting for an asynchronous database or web operation to complete. - An Async method shows long Total Time in CPU
The application may be spending a lot of time in continuations processing the resulting data before displaying it.
You can't currently use Find method in call tree to find async continuation methods.


