Setting up and running a profiling session
Published 11 June 2013
To profile an application, you set up a profiling session. A session has various settings and the profiler remembers your recent sessions so you can easily re-run them later.
A session specifies:
- the application type, location, and options for the application you want to profile
- the profiling mode, which determines the level of detail gathered by the profiler while your application is running
- the method used to calculate timing values (CPU time or wall-clock time)
- the performance counters to display on the timeline
When you start ANTS Performance Profiler, the startup screen is displayed.
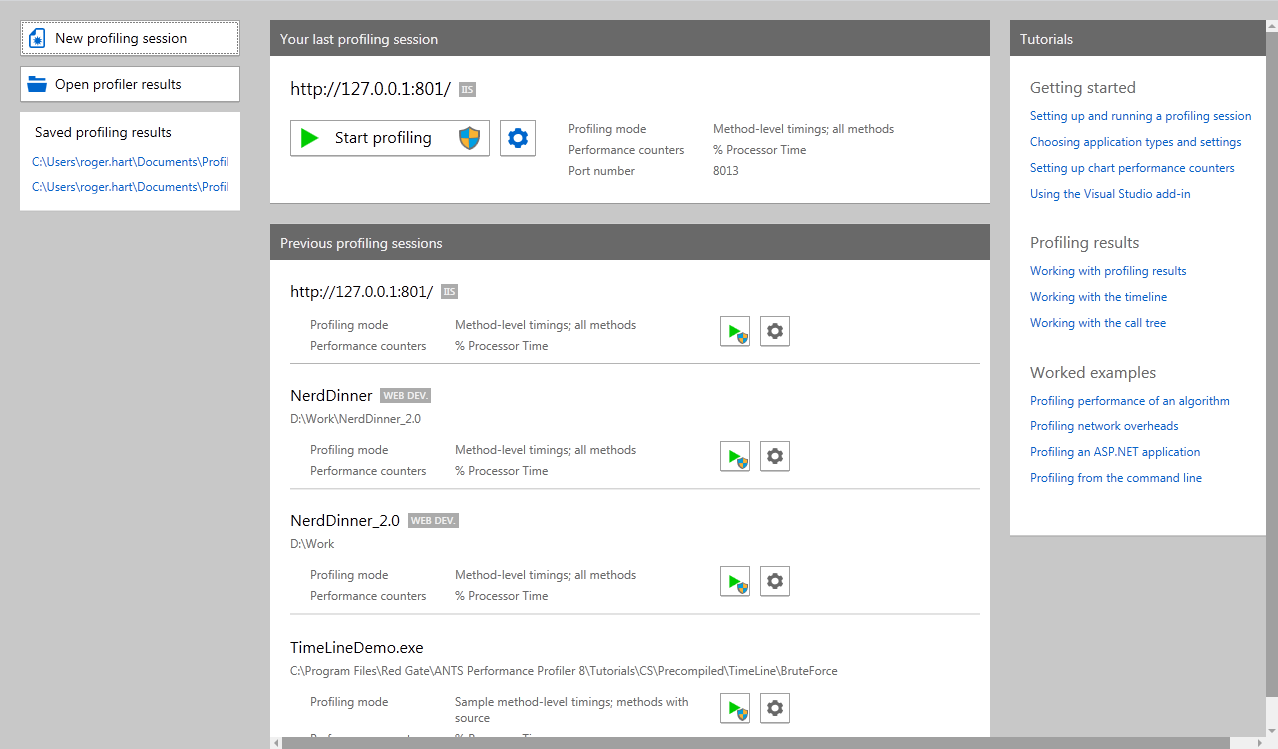
The startup screen shows your recent profiling sessions, if you have any, and links to tutorial and support content.
If you're using ANTS Performance Profiler for the first time, the startup screen shows some introductory information:
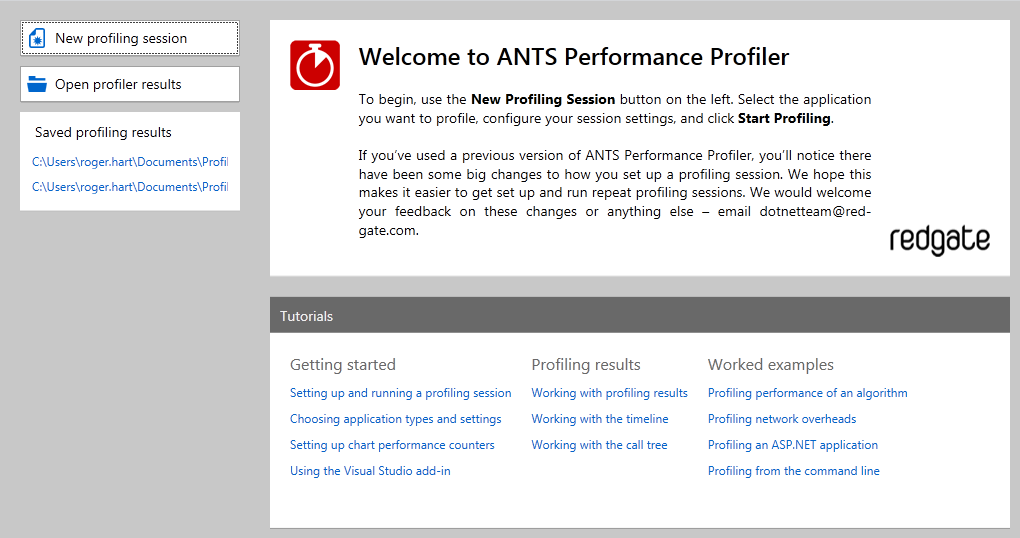
If you have used the profiler before, a list of your recent profiling sessions is displayed:
Setting up a new profiling session
On the startup screen, click New Profiling Session.
If ANTS Performance Profiler is already running, on the File menu, click New Profiling Session.
The settings screen will be displayed: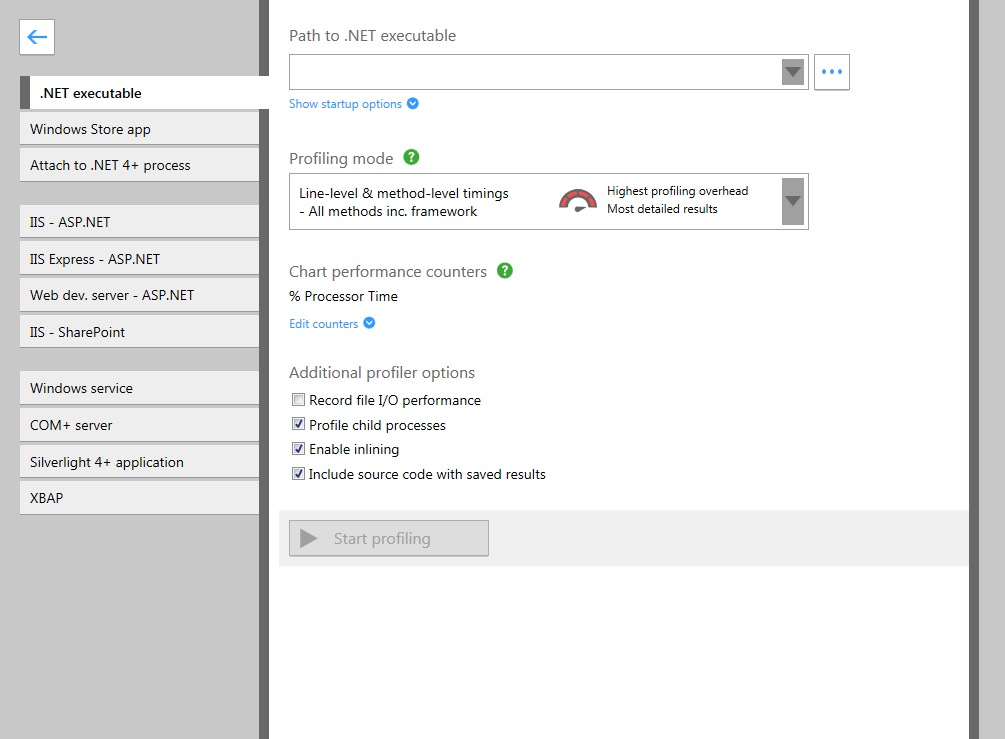
Choose which type of application you want to profile and complete the details on the settings screen. The settings available depend on the selected application type.
For more information on profiler settings, see Choosing application types and settings and Setting up chart performance counters.
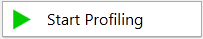
Click
On Windows Vista, Windows Server 2008, Windows 7, and Windows 8, if you are not running ANTS Performance Profiler as an Elevated administrator, the Start Profiling button has a User Account Control (UAC) shield: . The UAC shield indicates that ANTS Performance Profiler will request elevation when you start profiling.
The timeline is displayed at the top of the main ANTS Performance Profiler window, and the application you want to profile is automatically started.Status text at the bottom-left of the main window indicates what ANTS Performance Profiler is doing during the profiling session.
The timeline starts displaying performance-counter data and events in near-real time.There may be a slight delay between starting a profiling session and seeing the first performance-counter data appear on the timeline.
- To display profiling results, do any one of the following:
- Select a region on the timeline; see Working with the timeline.
Profiling data is summarized and displayed for the selected time period only. Your application will continue running and profiling will continue.
- Click
 to stop profiling.
Your application is closed. Profiling data is summarized and displayed for the entire profiling period. - Close your application.
Profiling data is summarized and displayed for the entire profiling period.
You can continue working with the timeline to locate periods of interest during the execution of your application, and to display the associated profiling results.
- Select a region on the timeline; see Working with the timeline.
Once you have displayed some profiling data, you can view and analyze it. For more information about the different ways you can do this, see Working with profiling results.
Rerunning a previous profiling session
You can access and rerun previous profiling sessions from the startup screen.
To show the startup screen, on the settings screen, click the arrow icon at the top left of the screen. The names of applications you have recently profiled are shown, followed by a summary of the application settings for each session:
To rerun a previous profiling session with these settings, click the button next to the session you want to profile. To rerun a previous profiling session with different settings, click the  settings button to display the settings screen.


