Overview pages
Published 31 January 2017
The overview pages in SQL Monitor show the health of your monitored servers at various levels.
The global dashboard is the default front page for SQL Monitor, but there is also an overview that list metrics for host machines, SQL Server instances, and databases. There is a separate overview page for availability groups and clusters.
The overviews are useful for analyzing server performance and diagnosing problems.
Understanding the instance/server overview page
The instance/server overviews show performance data, status and alert information for your monitored server. You can analyze server performance by clicking various parts of the page.
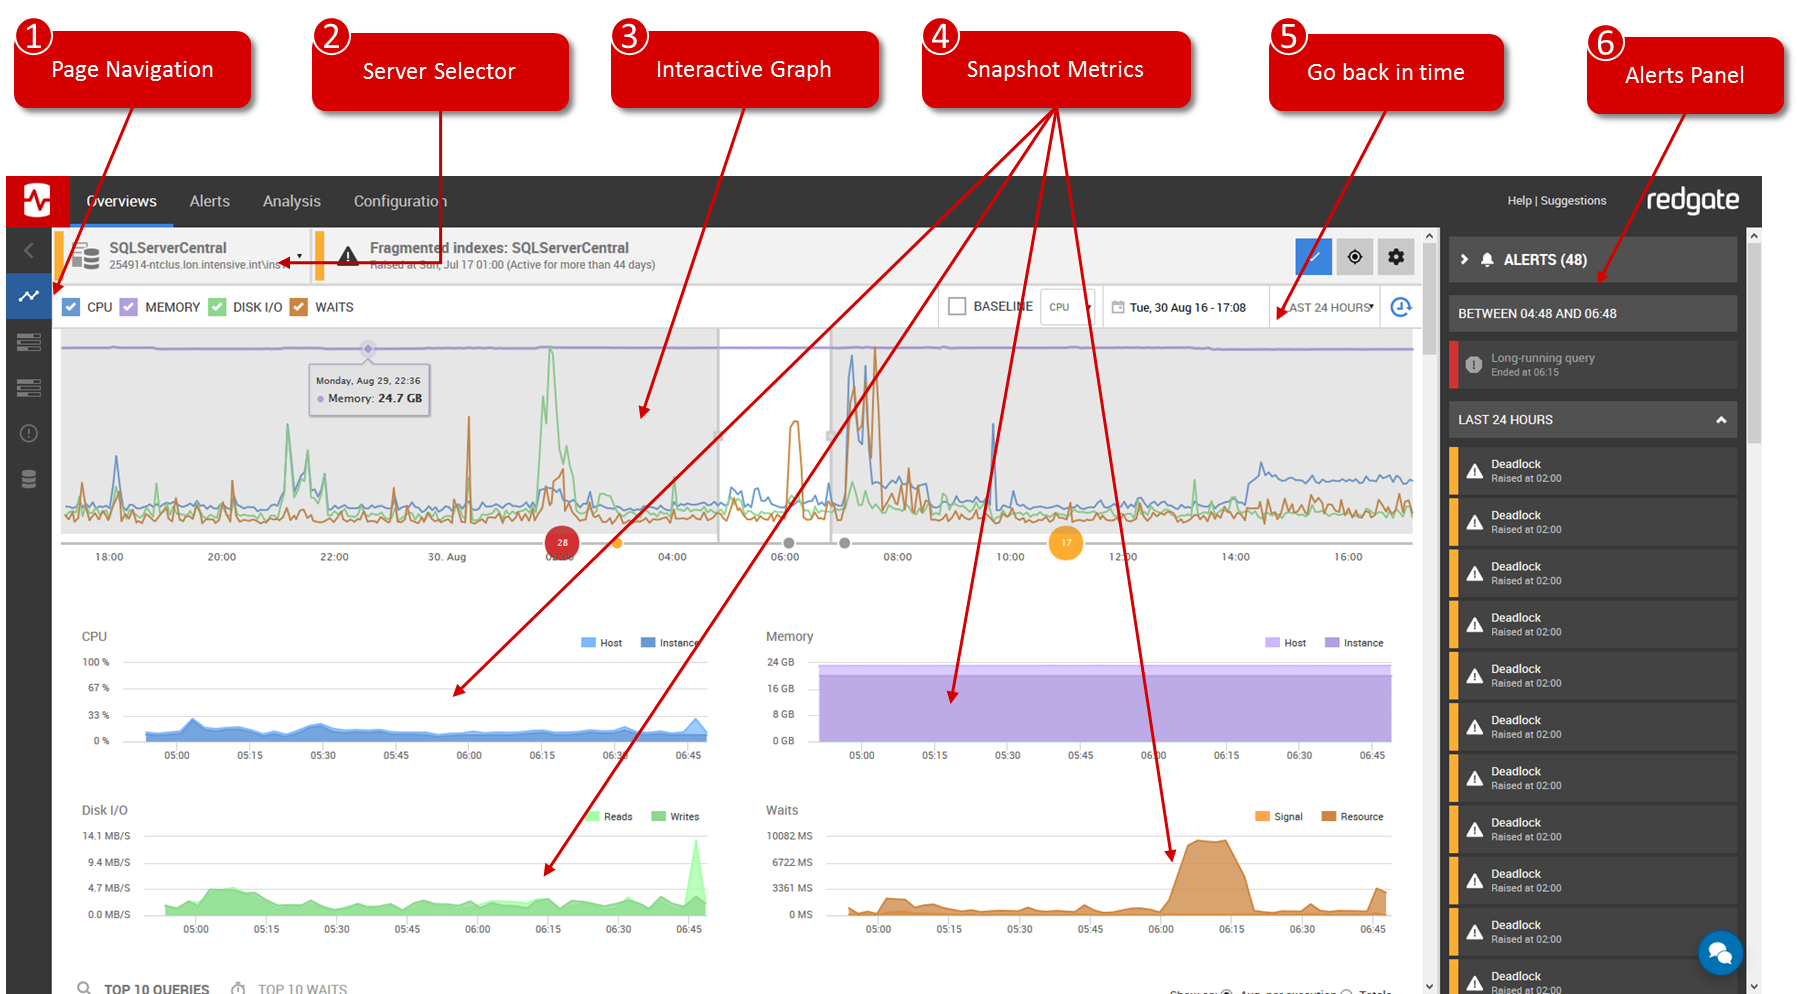
(1) Page Navigation
Hover over area to bring up the navigation panel to jump to Server/Host Metrics, SQL User Processes, Availability Groups (when set up), Processes, Error Log or Databases.
(2) Server Selector
Change to view information on your other Monitored Servers from the drop down list.
(3) Interactive Graph
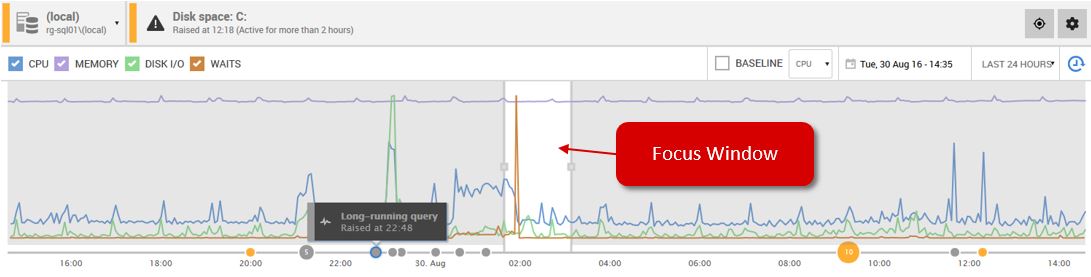
The graph displays CPU, Memory, I/O and Waits over a selected time period. The data sets can be turned on or off using the tick boxes and a baseline for an individual metric can also be displayed via the baseline checkbox/drop down. The time period shown can be changed to the last 6, 12, or 24 hours, 2 days or 3 days. If you want to select a smaller time period, you can drag the “Focus Window” to the area of the graph you are interested in (smallest time period is 15 minutes).
When an alert is raised a small circle appears along the bottom of the graph. Hovering over the circle brings up a summary of the alert and clicking on it brings up the details in the Alerts Panel (6). Similar alerts occurring at the same time are grouped together and a number will appear in the circle indicating the number of similar alerts raised.
The baseline represents the last three time periods that the graph is current set to. So if the time period is set to "Last 24 hours", the baseline will represent the previous 3 days' data.
(4) Snapshot Metrics
The graphs of the individual metrics correspond to the time period selected in the Focus Window above.
(5) Go back in time
Use the Back in Time feature to see the state of your data at some point in the past.
(6) Alerts Panel
The panel displays alerts that were raised in the time period selected by the Focus Window. Clicking on the alert will bring up the details and alert description. From here you can clear the alert, add a comment, configure the alert or go to the full details of the alert.
The Alerts Panel can be hidden by clicking the Alerts “bell” icon 
Understanding the additional information on the instance/server overview page
Below the graphs additional information is displayed, such as performance data and performance diagnostics. The majority of this information is for the time period selected in the Focus Window.
Server/Host Metrics
- performance data for the server and host machine
- performance diagnostics (top waits, top queries, SQL user processes, SQL Server error log)
Availability group overview
The status to the availability group is shown on the instance/server overview page. Clicking through to a more detail overview shows the primary replica and its databases, and all availability replicas and their databases.
It also shows:
- alerts, statuses, and failover information for availability replicas
- metrics for the databases
See Availability group overview for more details.
Databases
The database overview shows information about the database, its general properties, its data and log file sizes and locations, and backups.
It also shows:
- performance data (including the most recent backup of each type)
- performance diagnostics (top queries)
Cluster overview
The cluster overview shows all nodes in the cluster, and the SQL Server instances running on the cluster.
It also shows:
- information about which resource groups the various resources (including SQL Server instances) are allocated to
The resources are various entities that are capable of being managed by a cluster. A resource can only be owned by one node at a time. If the resources section is empty, see the troubleshooting page Resources section is empty.
A resource group is a collection of resources that are managed as a single unit (e.g. the SQL Server group). During a failover, the groups is moved from one node to another node.
For more information, see Cluster fundamentals (MSDN article).
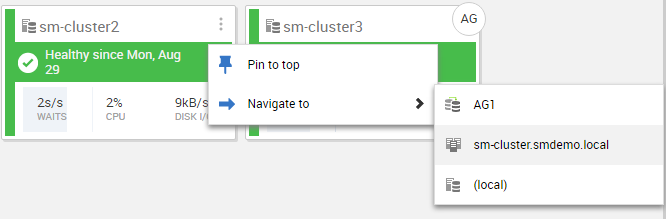
You can navigate to the cluster overview from the global dashboard:
- Find a card corresponding to an instance on a cluster and click the 3 dots in the top right corner.
- Go to 'Navigate to'.
- Select the cluster to navigate to the cluster overview.
Availability group overview
The availability group overview shows the primary replica and its databases, and all availability replicas and their databases.
It also shows:
- alerts, statuses, and failover information for availability replicas
- metrics for the databases
See Availability group overview for more details.


