What's new in ANTS Memory Profiler 8
Published 14 May 2018
Version 8 of ANTS Memory Profiler has the following new features:
New startup page
We've redesigned the way you set up a profiling session in ANTS Memory Profiler 8, to match the redesign in ANTS Performance Profiler 8.0.
It's now much easier to repeat a previous profiling session. Recent profiling sessions, and recently opened and saved profiling results, are accessible from the startup page.
We've also reorganized the steps for setting up a new profiling session, trying to make them as intuitive as possible.
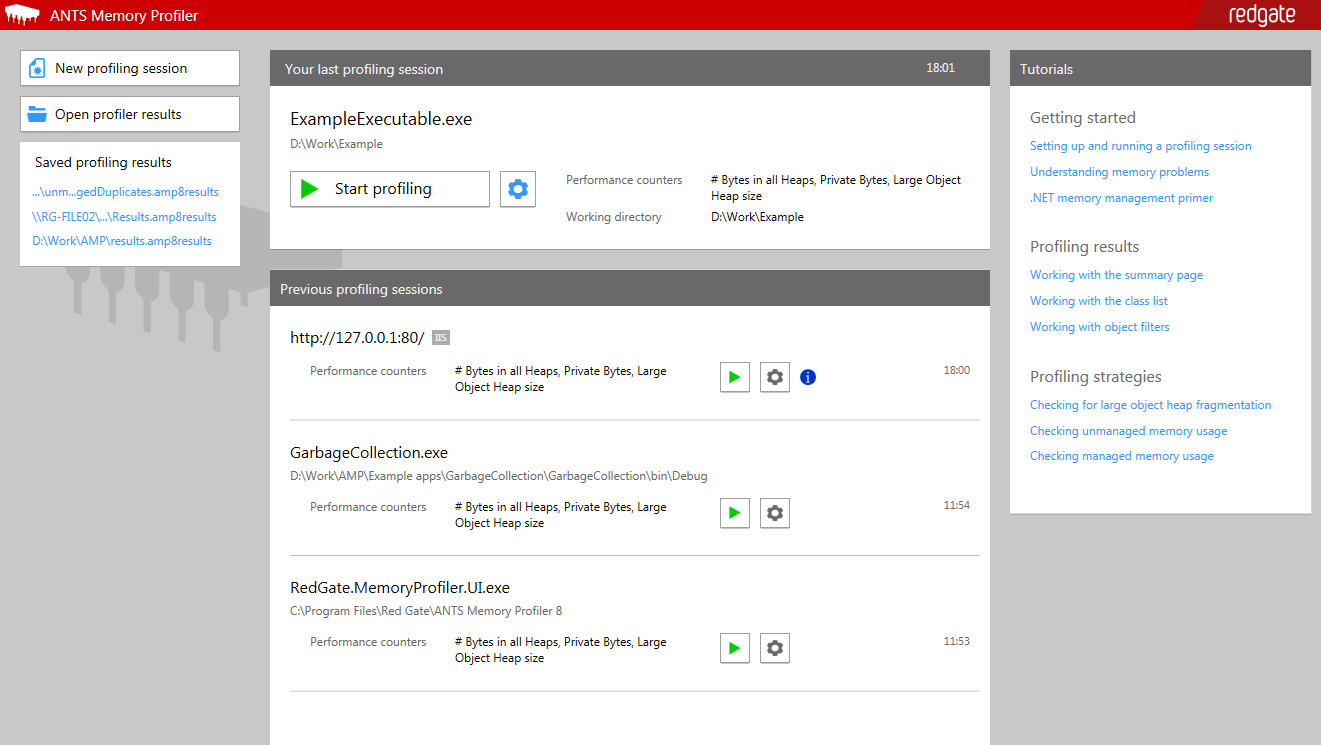
To try it out: Start a new profiling session.
Unmanaged memory profiling
In ANTS Memory Profiler 8, you can profile unmanaged memory allocations called from .NET code.
The Summary page will show you which modules are using the most unmanaged memory, and how this has changed between snapshots:
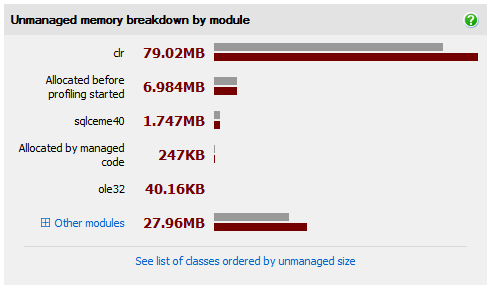
You can also see how much unmanaged memory is associated with managed classes and instances in the Class list and Instance list.
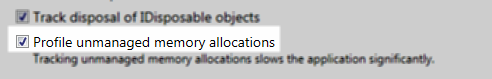
To try it out: When you're setting up the profiling session, select Profile unmanaged memory allocations under Additional profiling options.
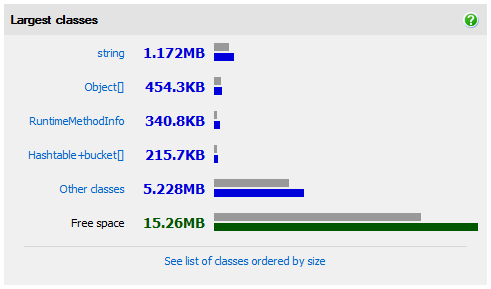
Redesigned largest classes section
The largest classes section on the Summary page now not only shows you the breakdown of memory by class, but also shows how this breakdown has changed between snapshots.
This makes it easier to identify classes that are growing, and classes that are large but maintaining a constant size.