Setting up a profiling session
Published 14 May 2018
In ANTS Memory Profiler, you profile your application in a profiling session. During a profiling session, you can see the memory your application is using in real time. Take snapshots to identify which objects are using memory at particular moments, and investigate any significant changes.
To set up a profiling session, select the application you want to profile, and choose any settings you want to profile with. For example, if you're profiling a web application, you might want to choose an unused port to profile on.
The startup page
When you start ANTS Memory Profiler, the startup page is displayed. From here you can:
- Set up a completely new profiling session.
- Run a profiling session with the same settings as a previous session.
- Open profiling results from a previous session.
- Get help for ANTS Memory Profiler.
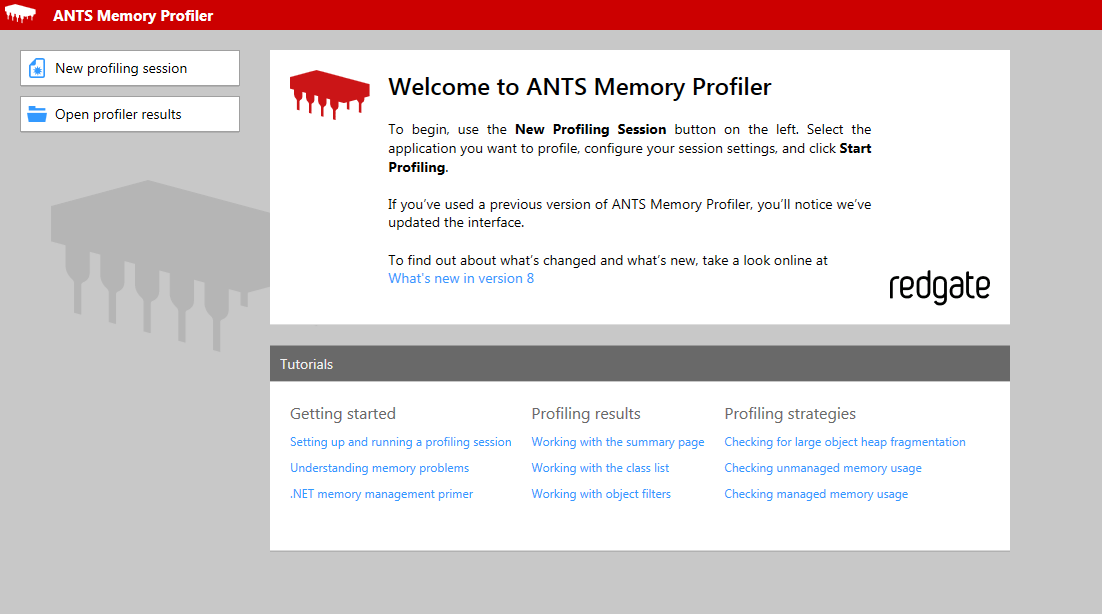
If you haven't run ANTS Memory Profiler before, the startup page shows you how to get started:
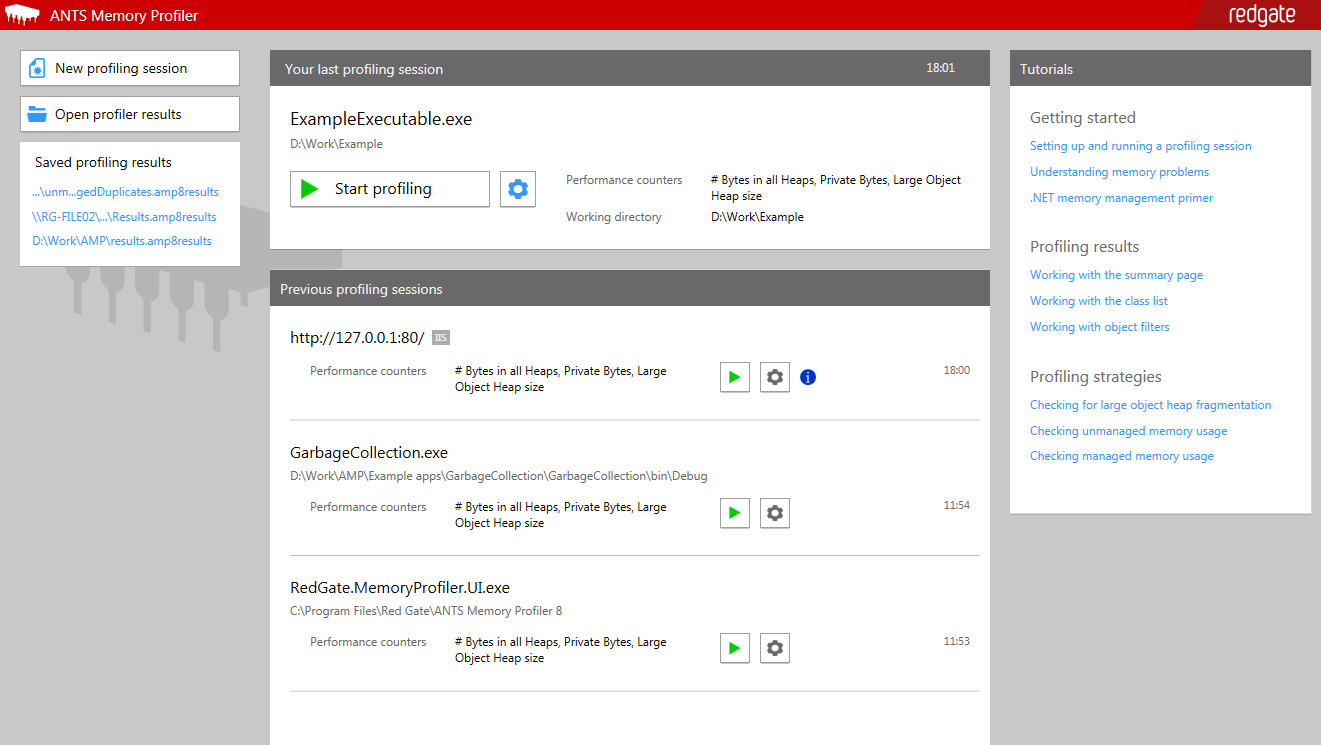
After your first profiling session, the startup page lists your most recent profiling sessions, and saved profiling results:
Running a profiling session with existing settings
Your most recent profiling session is displayed at the top of the startup page. To run a session with the same settings, click .
The settings for earlier profiling sessions are also displayed. To run a session with the same settings as one of these previous sessions, click .
To check or edit the settings of a previous session before running it, click .
Running a new profiling session
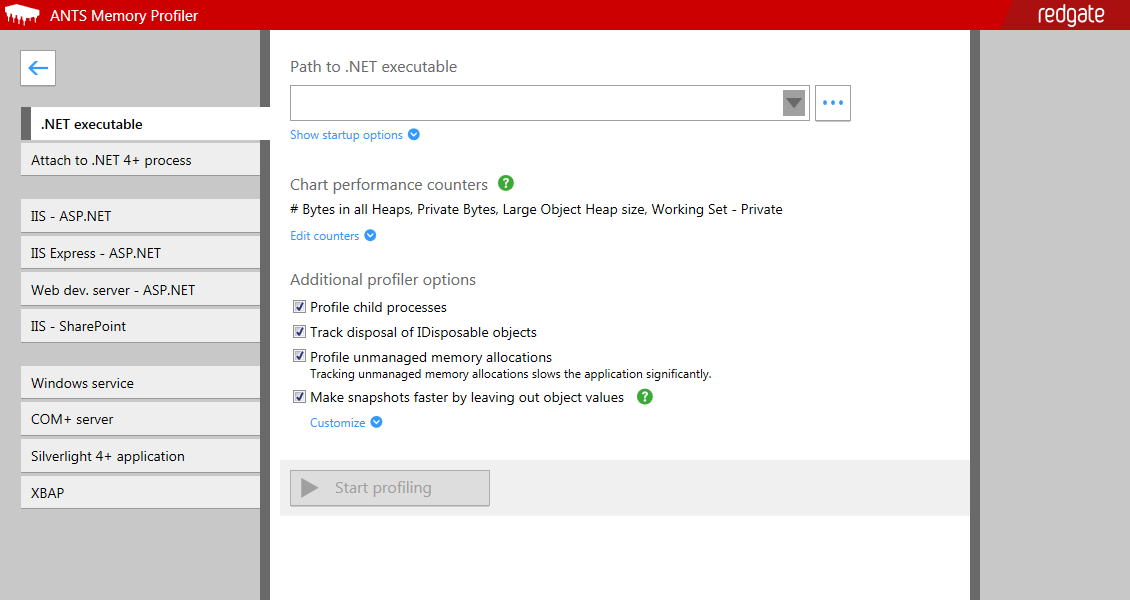
To run a new profiling session, click . On the next page, select the type of application you want to profile from the list on the left.
The profiling options for the selected application type are displayed on the right of the page.
Choose the type of application you want to profile for more details:
- Profiling a .NET executable
- Profiling an ASP.NET application on IIS
- Profiling an ASP.NET application on IIS Express
- Profiling an ASP.NET application on web development server
- Profiling SharePoint
- Profiling a Windows service
- Profiling a COM+ server application
- Profiling an XBAP (XAML Browser Application)
You can't profile Windows Store applications with ANTS Memory Profiler.
You can also start a new profiling session from the Visual Studio add-in.


