Finding out what is using most memory
Published 14 May 2018
Before finding out what is using most memory, we recommend that you first check for large object heap fragmentation and use of unmanaged memory.
If you are not familiar with memory profiling, you might find it helpful to read the .NET Memory Primer before you start.
You should not normally filter classes that you do not recognize. For example, if your code contains an array which itself contains a large number of byte arrays, you should start by looking at those byte arrays.
To find out what is using most memory:
- Start ANTS Memory Profiler and start profiling your application.
- Use your application until the point where you are interested in its memory. For example, if you believe that a lot of memory is used when a certain screen is displayed, use the application normally until the screen is shown.
- Click .
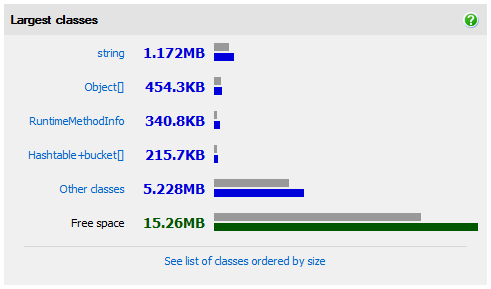
- On the Summary, look at Largest classes. The largest classes are shown in order of the amount of memory they use.
- Starting with the largest class, click each class in turn to see the instance categorizer for that class. For this analysis, you are exploring memory usage by following references to a class, so it is not important if you do not recognize these classes.
- Instances of the chosen class are grouped by the chain of references which holds them in memory, with the largest group of instances displayed at the top of the screen. Starting with the largest category, use the explorer to look at what is keeping your selected class in memory, reading the graph from right-to-left.
For example, System.String is often the largest class; using the instance categorizer you can find out what is keeping strings in memory, such as an event handler.
- If the largest class does not reveal interesting results, click Summary, and try again with the next-largest class, and so on.
- If you still cannot see why large amounts of memory are being used after you have examined all of the largest classes by size, click Other classes. The Class List is displayed. Sort the Class List by Live Instances, and look at the instance categorizer for the classes with the most instances.
After using the instance categorizer to find out why instances of a class are still in memory, you might find that some instances are being kept in memory by a type (most commonly an event handler) that should not be referencing those objects. If this happens, when viewing the instance categorizer:
- Click Show instances on this path.
- The Instance List is displayed, showing the instances of the object which are retained on the path previously shown in the instance categorizer.
- Click on any instance to select it (it doesn't matter which one, because they are all on the same shortest path) then click to display the instance retention graph.
- Look for the reference that should not be there on the instance retention graph, which shows all paths holding the object in memory.
- Change your code to remove the incorrect reference, and then check that the problem is fixed.
For more information, see the Worked Example.


