Profiling on IIS
Published 14 December 2012
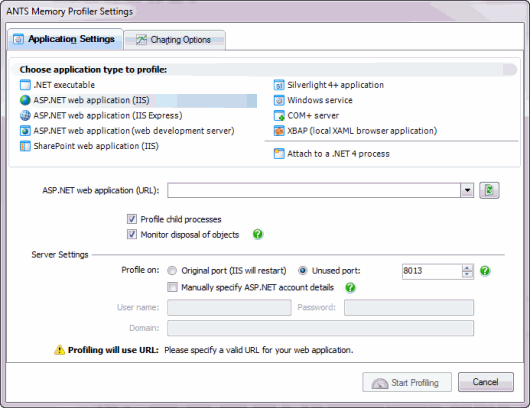
To profile ASP.NET applications running on IIS, on the ANTS Memory Profiler Settings dialog box, perform the following steps:
- Start ANTS Memory Profiler. If it's already running, on the File menu, click New Profiling Session.
- Under Choose application type to profile, select ASP.NET web application (IIS).
- Next to ASP.NET web application (URL), click the refresh icon.
ANTS Memory Profiler displays a list of applications currently running on IIS. Choose the application you want to profile. - Normally, you'll want to keep Profile child processes and Monitor disposal of objects selected, but this can affect your application's performance.
- If needed, choose an Unused port to profile on.
This means that IIS won't need to restart, but it won't work if you've hard-coded a specific port in your web application.
(This option is not available in IIS 5.) - With IIS 6 and 7, your web application will run under the Windows Local System user by default.
If needed, change the user account your application will run under by selecting Manually specify ASP.NET account details. The specified user must have administrator privileges and permission to read from %ProgramFiles%\Red Gate\ANTS Memory Profiler 7\RedGate.Memory.Core.dll
With IIS 5, your web application will always run under the ASPNET account. Make sure that the ASPNET account has permission to read from %ProgramFiles%\Red Gate\ANTS Memory Profiler 7\RedGate.Memory.Core.dll - The Profiling will use URL notice confirms the URL that will be used for profiling, including any unused port you have set.
- If needed, change the performance counters to record.
- Click .
- Check whether there are any memory problems.


