Upgrading to ANTS Memory Profiler 7
Published 18 December 2012
Summary
The new Summary in ANTS Memory Profiler 7 includes information which we think you will find more useful when trying to trace memory problems. This means that some of the information shown on the ANTS Memory Profiler 6 summary is no longer available, or has been moved.
The following list explains where to find information shown on the Summary in previous versions of ANTS Memory Profiler, in ANTS Memory Profiler 7:
Filters
The filter panel has been removed from the summary because filters have no effect on the summary (they didn't in version 6, either). The filter panel is available on other parts of the workflow, however.
Classes with largest size (in the current snapshot)
This information is available in the Largest classes pie chart.
Classes with most instances (in the current snapshot)
Switch to the Class List and then sort it by Live Instances.
Large object heap details
- Free space on all .NET heaps: On the Summary, in the .NET and unmanaged memory section, see Unused memory allocated to .NET
- Largest free block: On the Summary, in the Memory fragmentation section, see Largest fragment.
- Max. size of new object (approx.): This information is no longer available, because it is not generally useful.
Largest growth in size (comparison)
Switch to the Class List, and then sort it by Size diff.
Largest growth in instances (comparison)
Switch to the Class List, and then sort it by Instance diff.
Large object heap changes
- Change in free space: This information is no longer available from ANTS Memory Profiler because it is rarely useful, but you can calculate it.
- Switch the current snapshot to an earlier snapshot (which you will use as baseline).
- On the Summary, in the .NET and unmanaged memory section, note the value given for Unused memory allocated to .NET.
- Switch to the later (comparison) snapshot.
- Subtract the Unused memory allocated to .NET from the first value.
- Change in largest free block: This information is no longer available from ANTS Memory Profiler because it is rarely useful, but you can calculate it.
- Switch the current snapshot to an earlier snapshot (which you will use as baseline).
- On the Summary, in the Memory fragmentation section, note the value given for Largest fragment.
- Switch to the later (comparison) snapshot.
- Subtract the Largest fragment from the first value.
- Change in max. size of new object: This information is no longer available, because it is not generally useful.
Filters
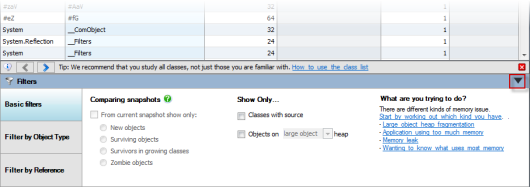
Filter panel
This is now shown at the bottom of the Class List, Instance Categorizer, and Instance List. The filter panel can be collapsed when not needed using the arrow.
Behavior when multiple filters are selected
In ANTS Memory Profiler 6 and earlier, when you enable more than one filter, there was normally an 'AND' relationship between most filters: only objects matching all of the filters were shown. There was one exception, however: when filtering by reference from more than one class or namespace, objects matching either filter were shown (an 'OR' relationship).
In ANTS Memory Profiler 7, there is an AND relationship between all filters. If you filter by reference from more than one class or namespace, only objects which are referenced by all of the selected classes/namespaces are shown.
Process filter
For applications using more than one process, the Process filter is no longer on the Filters panel. On the Summary and the Class List, select the process you want to view by using the dropdown list beneath the timeline. The process selected by default is the process that started first.
Class Reference Explorer
The former Class Reference Explorer has been replaced in the workflow by the Instance Categorizer. The Instance Categorizer's default Categorized references view takes the objects which account for 60% of the memory usage by the class, and then categorizes them by the path which keeps those objects in memory. We hope that you will find this more useful.
If you would prefer to use the old Class Reference Explorer, switch the Instance Categorizer to All references view.
Object Retention Graph
The Object Retention Graph is now called the Instance Retention Graph. This name change is only for technical accuracy. The only change in the Instance Retention Graph is that field values are now available in the graph.
WPF support
In ANTS Memory Profiler 6, a property that is set as a dependency property was not shown in the properties for the class it was associated with. In ANTS Memory Profiler 7, dependency properties are shown on the list of properties.


