Working with the timeline
Published 17 December 2012
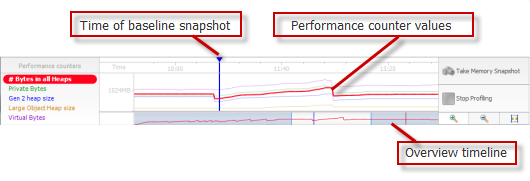
The timeline shows performance counter values and instances of events related to the application you are profiling. You can use the timeline to investigate memory profiling results for specific time periods.
The timeline shows the values for a selection of Windows performance counters. You can choose which performance counters to display before you start profiling your application. For more information, see Setting up performance counters.
Snapshots
While you are profiling your application, click the Take Memory Snapshot button to record memory usage at the present moment.
Taking a snapshot calls the GC.Collect method, which runs the .NET garbage collector. ANTS Memory Profiler then displays the objects that survive the garbage collection. For more information, see the .NET memory management primer.
Select the snapshot that you are interested in as the Current snapshot and select a snapshot to compare it with as the Baseline snapshot.
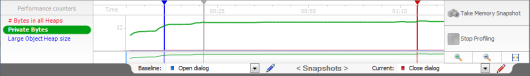
You can name a snapshot to make it easier to identify. To name a snapshot, click  next to its name, and type the new name, followed by the Enter key. The name is shown on the snapshot's tooltip and in the Baseline: / Current: combo boxes beneath the timeline.
Adjusting the time scale
You can change the time scale to view performance-counter data in more or less detail by rotating the mouse wheel, or by using the zoom-control buttons (zoom in  , zoom out
  , and zoom to fit
  ). You can also use the following keyboard shortcuts: CTRL+PLUS to zoom in; CTRL+MINUS to zoom out.
To pan the main timeline, move the mouse pointer over the highlighted area in the overview timeline ( ), and drag to the left or right.
Troubleshooting the timeline
If you are profiling a Silverlight application, the heap size counters are not displayed in the timeline. This is due to a limitation in Silverlight. Click the Session Overview tab to show these values.
If you are not profiling a Silverlight application, and you cannot see the performance counters in the timeline, you may need to rebuild your performance counters.
Counter values may be different from those shown in Performance Monitor or Windows Task Manager, because there are different ways of counting memory usage. For more details, see Setting up performance counters.
This documentation contains proprietary information and is protected by copyright law.
Copyright © 2026 Red Gate Software Limited. All rights reserved


