Profiling a COM+ server application
Published 17 December 2012
Requirements
To profile a COM+ server application, set the ApplicationActivation attribute to this:
[assembly: ApplicationActivation(ActivationOption.Server)]
If you can't set this attribute (for example, if you don't have access to the source code), or if you set it to ActivationOption.Library, you can profile the COM+ application by profiling the client application as a .NET executable. Be aware that the resulting server application:
- won't be a true COM+ application, and will run in the client process
- will be treated by ANTS Memory Profiler as a DLL invoked by the client
You may need to make the application's code fully trusted by setting the ApplicationAccessControl attribute to:
[assembly: ApplicationAccessControl(false)]
You should not release the COM+ application in this trusted state.
Running a profiling session
To profile a COM+ server application:
- Start ANTS Memory Profiler and click

- From the list of application types, select COM+ server.
- Select the COM+ server application you want to profile from the drop-down list:
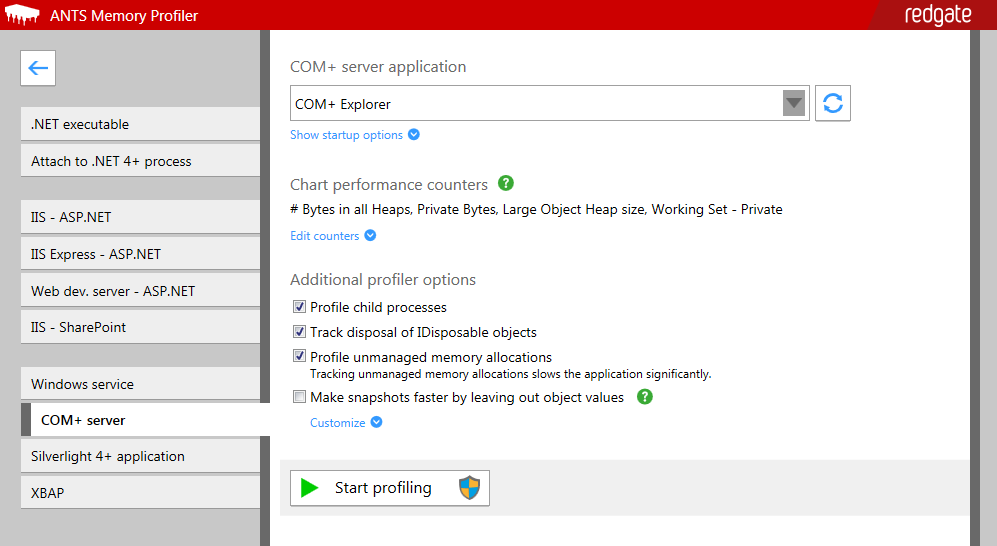
Click if the server application isn't in the list.
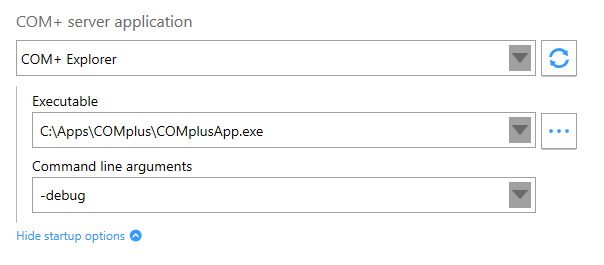
 - If you want to specify the executable to profile, or enter command line arguments for the application to use at launch, click Show startup options:
- If you want to record extra performance counters, click Edit counters and select the counters you want.
Move your mouse pointer over a performance counter to read more about it.
For more information about performance counters, see Setting up performance counters. - Under Additional profiler options:
- Select Profile child processes to include any processes created by your application in profiling.
If your application has lots of child processes, this option will slow down your application. - Select Track disposal of IDisposable objects to keep track of when IDisposable objects in your application are disposed.
This option will slow down your application slightly. Select Profile unmanaged memory allocations if your application access unmanaged memory through P/Invoke or COM+, and you want to profile the unmanaged memory that your application uses.
(Not available in Windows XP / Server 2003 and earlier, or when profiling .NET 1.1 applications.)This option will slow down your application by up to fifty percent, because a lot of additional information is being tracked.
- Select Make snapshots faster by leaving out object values if you've had problems with snapshots being too slow or too large.
You won't be able to see the values of individual instances, but references between objects aren't affected.
If you want to see the values of strings or the contents of arrays specifically, click Customize and deselect the relevant option.
- Select Profile child processes to include any processes created by your application in profiling.
- Click

The main profiling window is displayed, and your application will launch.
On the timeline, you can see the memory being used by your program, along with any other performance counters you selected. - When your application is in a stable state (ie is fully started up and ready for normal use), click
A memory snapshot gives you a detailed breakdown of the memory being used at that point in time, so that you can compare it with later snapshots. - When you've taken at least two snapshots, you can start to investigate your application's memory usage. See Strategies for memory profiling.
This documentation contains proprietary information and is protected by copyright law.
Copyright © 2026 Red Gate Software Limited. All rights reserved


