Profiling ASP.NET applications running on IIS Express
Published 14 May 2018
IIS Express is a free version of IIS, commonly used in development environments. IIS Express can run on development machines without requiring the installation of a full web server, and does not require an administrator account to run. This makes it convenient for testing debug builds of web applications.
You can profile sites running on IIS Express by following the instructions below.
Setting up the Performance Profiler
Option 1: Manually selecting application to profile
If your application is not available via the applicationhost.config file, you can configure it manually.
- From the list of application types, click IIS Express - ASP.NET.
Provide a path to your web application's directory in the ASP.NET web application path field. Usually this is a directory containing a Web.config file.
If the ASP.NET web application path field is not visible, click Profile an application not shown in this list.
- If required, you can set the Port, Start page preferred CLR version, and run the app as 32-bit by clicking Show server options, or set Environment variables by clicking Show startup options:
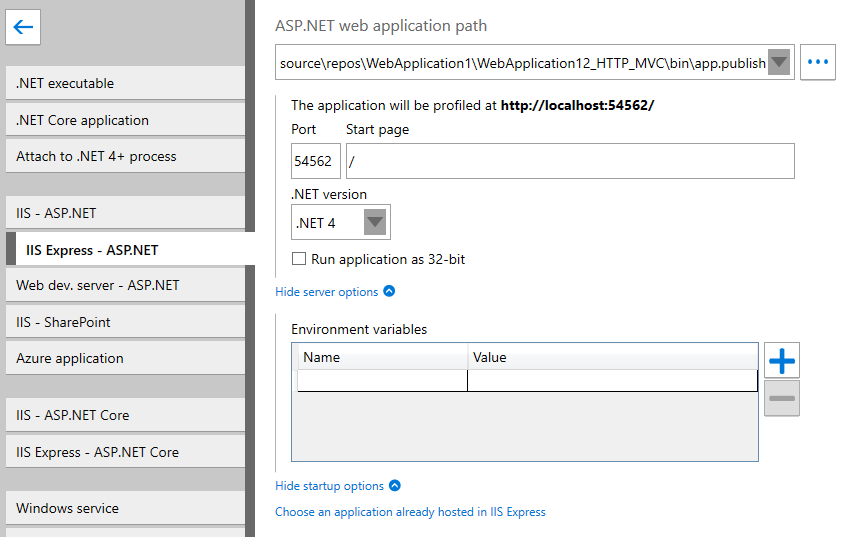
- Select the required Profiling mode, Chart performance counters, Additional profiler options, and the browser to launch the application.
For more information, see Choosing application types and settings and Setting up chart performance counters.
Note that SQL queries and incoming HTTP calls will be profiled automatically. - Click

Option 2: Profiling applications already configured in applicationhost.config file
You can profile websites already installed to your default applicationhost.config file or provide the path to your own configuration file.
- From the list of application types, click IIS Express - ASP.NET.
Confirm that a correct path to applicationhost.config file is provided in the Configuration file field.
If you want to profile a previously debugged website, you can use a config file generated by Visual Studio. This file is usually located in a hidden .vs directory in your solution folder, e.g. C:\SolutionDirectory\.vs\SolutionName\config\applicationhost.config.If the Configuration file field is not visible, click Choose an application already hosted in IIS Express.
- When the configuration file is selected, ANTS Performance Profiler will list all available applications in a Site dropdown list. Select a desired application from the list.
- If required, you can set the Start page and run the app as 32-bit by clicking Show start URL options, or set Environment variables by clicking Show startup options:
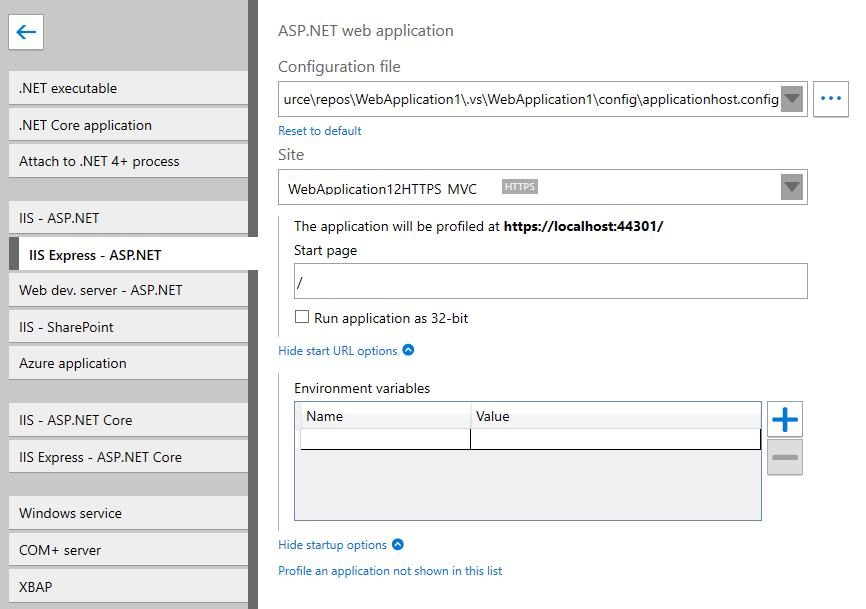
- Select the required Profiling mode, Chart performance counters, Additional profiler options, and the browser to launch the application.
For more information, see Choosing application types and settings and Setting up chart performance counters.
Note that incoming and outgoing HTTP requests will be profiled automatically. - Click
IIS Express starts and the web application is shown in your default browser. During a profiling session you can interact normally with your application and with the profiler.
When you have finished interacting with your web application, click the  button in ANTS Performance Profiler to stop profiling.
This closes the ASP.NET application. ANTS Performance Profiler shows all of the profiling data collected for the application.
Unlike in previous versions, closing the browser window does not cause profiling to stop in ANTS Performance Profiler 10.
This documentation contains proprietary information and is protected by copyright law.
Copyright © 2026 Red Gate Software Limited. All rights reserved


