Profiling ASP.NET Core applications running on IIS
Published 17 November 2020
Profiling ASP.NET Core applications on IIS requires a little more configuration than a basic .NET Core application. You specify a URL for the application, the relevant server options, and choose a profiling mode and performance counters. However, the settings you need depend on the version of IIS you are running, and the ports your application is using.
This article steps through both processes and explains the additional options you can choose.
You can only profile ASP.NET Core applications running on the computer where the profiler is installed.
If you're profiling a HTTPS website, you may see browser warnings, which you can safely ignore. If they appear, it's because the address being profiled doesn't match the domain name on the certificate.
Profiling ASP.NET Core applications is available only on IIS 7 and later.
To profile ASP.NET Core applications running on IIS:
- From the list of application types, click IIS - ASP.NET Core.
- Select the URL for ASP.NET web application for the web application that you want to profile.
To load a list of currently-running sites from IIS into the dropdown list, click
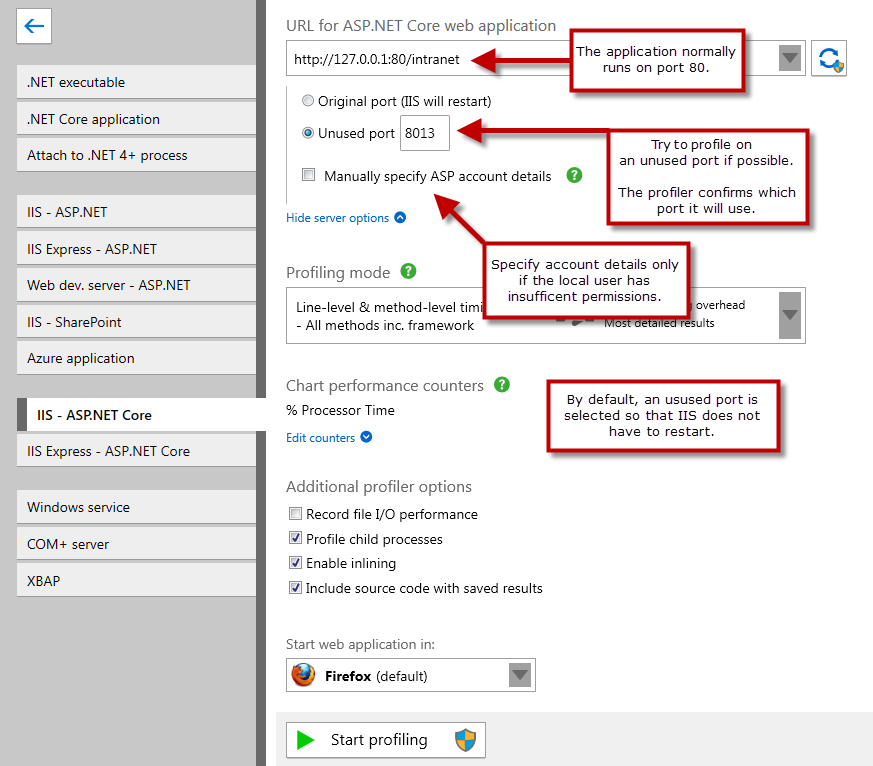
Note that the port specified in this URL is the port where the application usually runs under IIS, which is not necessarily the same as the port where the application is to be profiled.
(This is explained in more detail in step 4). - To set your server options, click Show server options.
Port and ASP account settings are displayed: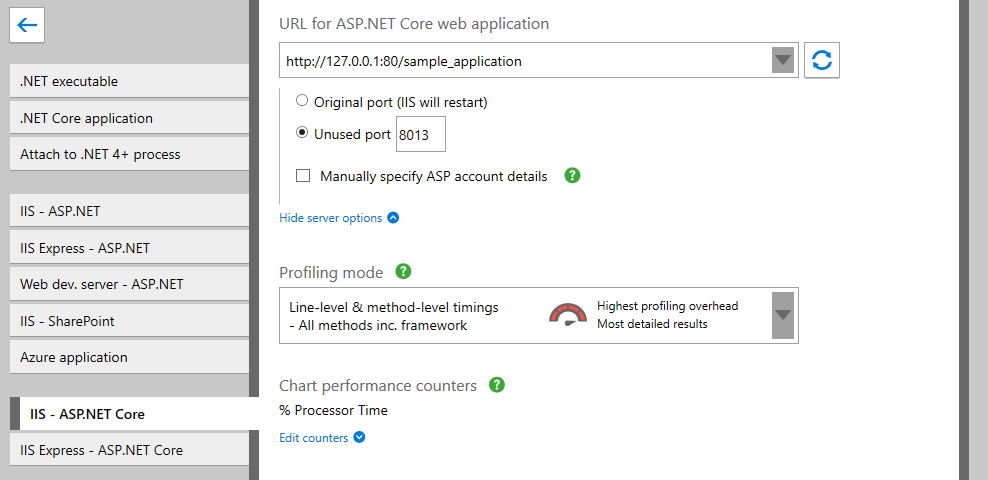
From the server options, choose a port.
The port you profile on depends on your version of IIS. The profiler automatically detects the version of IIS you are using.
If you are using IIS 7 and later, you can choose to profile on the original port or on an unused port:
Select Unused port if your application does not bind to a specified port. ANTS Performance Profiler will start a new instance of your application on the specified port, avoiding a restart of IIS. The port where the application will be profiled is displayed at the bottom of the settings screen.
If you're profiling an HTTPS website, you cannot profile on an unused port.
Select Original port if your application's code binds to a specific port. ANTS Performance Profiler will stop your application, attach to it, and restart it on the original port.
- Specify which user to run the profiling session as.
From the server options, select Manually specify ASP.NET account details and enter the User name, Password and Domain.- With IIS 7 and later, ANTS Performance Profiler profiles your web application as the Windows Local System user by default. This is appropriate for most websites. However, if your web application connects to a remote server (such as a database server), the Windows Local System user might not have appropriate permissions to make the remote connection. In this case, enter the credentials of a user who does have the required permissions. Note that the user you specify must be an administrator, and must have permission to read from %ProgramFiles%\Red Gate\ANTS Performance Profiler 10\ProfilerCore.dll and %ProgramFiles%\Red Gate\ANTS Performance Profiler 10\X64\RedGate.ProfilerCore.dll
- Select the required Profiling mode, Chart performance counters, and Additional profiler options.
For more information, see Choosing application types and settings and Setting up chart performance counters.
Note that incoming and outgoing HTTP requests will be profiled automatically. - From the browser dropdown, choose a browser to launch the application.
- Click

ANTS Performance Profiler launches the IIS user mode worker process (w3wp.exe), using a cut-down configuration file based on the site's applicationHost.config configuration file. The chosen browser then starts and displays your web application.
During a profiling session you can interact normally with your web application and with the profiler.
When you have finished interacting with your web application, click the  button in ANTS Performance Profiler to stop profiling.
Summary:
Closing your browser window will not cause profiling to stop.
See also Profiling an ASP.NET application (worked example).
Troubleshooting
If you encounter problems while trying to profile an application in IIS, see Troubleshooting IIS profiling.
This documentation contains proprietary information and is protected by copyright law.
Copyright © 2026 Red Gate Software Limited. All rights reserved


