Troubleshooting SQL call and HTTP request profiling
Published 14 May 2018
ANTS Performance Profiler automatically captures performance data for any SQL calls and incoming HTTP requests your application makes during profiling.
Missing SQL calls and HTTP requests in your results
This may be due to one or more of the following:
- You are using ANTS Performance Profiler Standard edition.
SQL call and HTTP request profiling are available in ANTS Performance Profiler Professional edition only.
For information on upgrading ANTS Performance Profiler, see Upgrading. - You are profiling in sampling mode.
SQL call and HTTP request data are captured only in line-level and method-level profiling modes.
For more information about profiling modes, see Choosing a profiling mode. - You are profiling an application compiled into an NGen profile image.
ANTS Performance Profiler cannot intercept SQL calls and HTTP requests for NGen profile images loaded at runtime.
To disable the NGen image for the profiled application, at the command prompt, typengen uninstall * /profileand start a new profiling session.
Missing SQL calls only
This may be due to one or more of the following:
- Your application calls a database using unsupported ADO.NET drivers.
Currently, ANTS Performance Profiler captures timing data for calls to all SQL, Oracle, and SQL Services (formerly SQL Azure) servers, wherever they are hosted, for supported ADO.NET drivers.
Calls to databases that use other ADO.NET drivers (including MySQL, MongoDB, and PostgreSQL) are not currently instrumented, so no timing data for these SQL calls is shown.
You can request support for other server types on the ANTS Performance Profiler Uservoice forum. - Your SQL calls are made asynchronously.
ANTS Performance Profiler does not capture timing information for asynchronous SQL operations.
Begincalls (e.g.BeginExecuteReader) to SqlCommand are not captured. StandardExecutecommands (e.g.ExecuteReader) will be profiled. - Your calls use a non-standard SQL API.
ANTS Performance Profiler instruments several standard interfaces for calling databases, but calls made via less common APIs may not be captured. If you think this is the case for your application, please contact Support, giving as many details as possible of your implementation.
Missing HTTP requests only
This may be due to the following:
- The page consists entirely of static content not content generated dynamically by the ASP.NET application.
By default, ANTS Performance Profiler does not capture page load events that render only static content.
If you want to see static content load events in the call tree, add the following setting to your application's web.config file:<system.webServer> <modules runAllManagedModulesForAllRequests="true" /> </system.webServer>
Time for SQL calls and HTTP requests appears less in the call tree than the suggestion bar
In the call tree, the total time shown for the calls/requests may appear to total less than the amount shown in the suggestion bar:
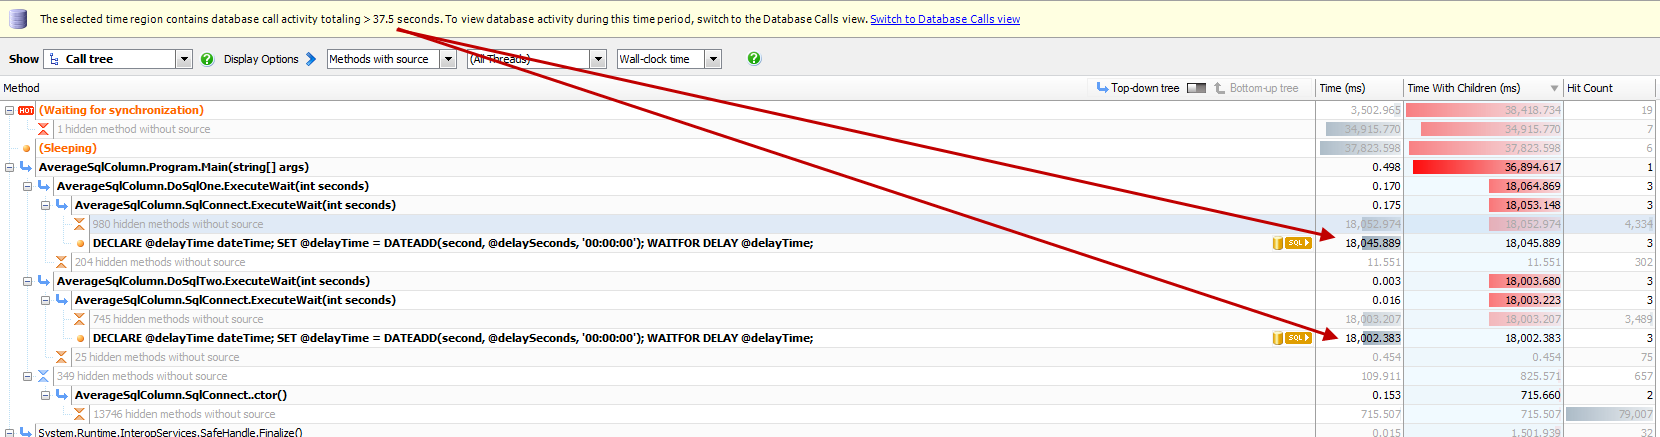
This is because the suggestion bar shows an estimate based on the total for all methods in that namespace, and so it may include connection time, for example. The timings in the call tree are accurate.
This documentation contains proprietary information and is protected by copyright law.
Copyright © 2026 Red Gate Software Limited. All rights reserved


