Worked example - Profiling performance of an algorithm
Published 14 May 2018
This worked example shows how you can use ANTS Performance Profiler to identify the most time-critical parts of a demonstration application, particularly where two different approaches to a problem are optimal in different circumstances.
Aims of the worked example
This worked example demonstrates a realistic programming scenario: it compares two methods for testing if a number is prime, to find out which is more efficient when the number being tested is large.
It also shows that you can select just a portion of the timeline when analyzing results, for example so you can ignore a slow initialization phase.
Introducing the demo application
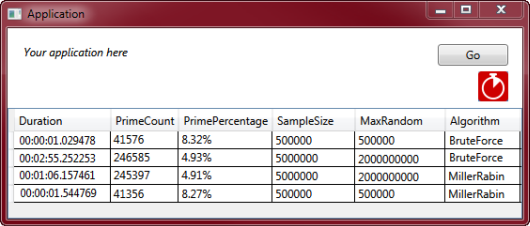
This worked example uses the TimeLineDemo, a simple Windows application that checks which of a set of numbers are prime.
There are two different versions of TimeLineDemo. The Brute Force configuration uses a brute force to check if a number is prime. The Miller-Rabin configuration uses the Miller-Rabin algorithm to check if a number is prime.
TimeLineDemo has two inputs:
- Max Random
- Sample Size
When TimeLineDemo starts, it generates prime numbers for 15 seconds, which gives it a slow initiialization phase. Then, when you click Go, it creates Sample Size positive integers, between 1 and Max Random. For each integer, TimeLineDemo checks if the number is prime, using the following algorithm:
- If the number is in the list created in the first 15 seconds, it is prime.
- If a number in the list created in the first 15 seconds is a factor of the current number, the current number is not prime.
- In all other cases, use either a brute force mechanism or the Miller-Rabin algorithm to check if the number is prime.
Strictly speaking, the Miller-Rabin algorithm is probabilistic. For the purposes of this demonstration, however, the algorithm can be assumed to be deterministic. This is because the algorithm's results are exact for integers which are smaller than the largest integer that the field accepts.
Walkthrough
We're going to start by seeing how the Brute Force build does with relatively small numbers as input.
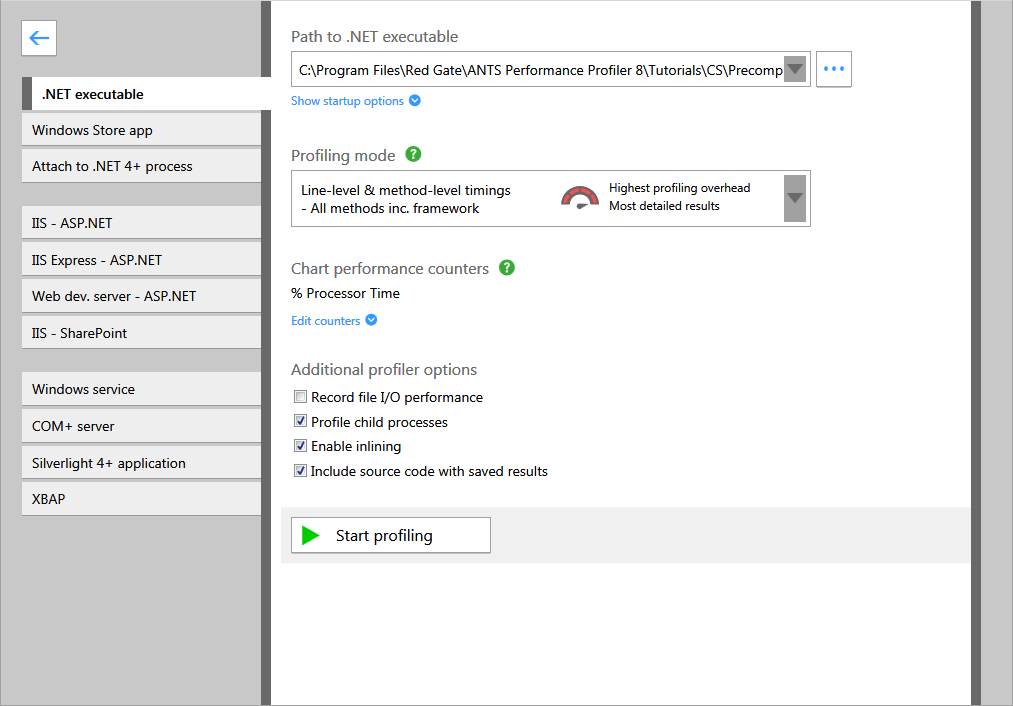
- Start ANTS Performance Profiler and click New profiling session.
- From the list on the left, select .NET executable.
- Enter the path to the brute force build of TimeLineDemo.exe
This is %Program Files%\Red Gate\ANTS Performance Profiler 8\Tutorials\CS\Precompiled\TimeLine\BruteForce\ - Click Start profiling.
- If an elevation permission dialog opens, grant permission.
TimeLineDemo starts and goes through the initialization phase.
Once that's finished, you can see on the timeline that processor use drops to almost nothing. - In TimeLineDemo, click the ANTS Performance Profiler logo to open the Configuration dialog.
- We're going to start with fairly small numbers. Set MaxRandom to 500000 and SampleSize to 500000:
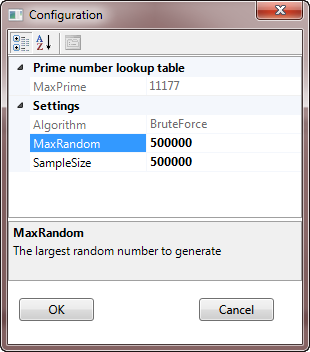
Click OK. - In the main application window, click Go.
TimeLineDemo performs the calculations. - To see the expensive calculation methods, select that phase in the timeline.
- On the right-hand side under the timeline, next to Timing options, select Milliseconds as the unit of measurement.
- In the Call tree, select RedGate.Demo.MainWindow.<GoButtonClick>
- The calculations didn't take long - in the screenshot, it's 1121 milliseconds.

Now we'll see how the Brute Force configuration deals with larger numbers.
- On the File menu, click New Profiling Session.
If a warning dialog comes up, click Continue Anyway. - On the main ANTS Performance Profiler page, click Start Profiling
- When TimeLineDemo has started, click the ANTS Performance Profiler logo to open the Configuration dialog.
Now we're going to try much larger numbers. Set MaxRandom to 2000000000 and SampleSize to 5000000, then click OK.
An advance warning: this could take quite a long time!
- In the main application window, click Go.
TimeLineDemo performs the calculations. - Select the calculation phase in the timeline, then, in the call tree, look at RedGate.Demo.MainWindow.<GoButtonClick>
- This time, the calculations took much longer - in the screenshot, it's 182,987 milliseconds or over 3 minutes.
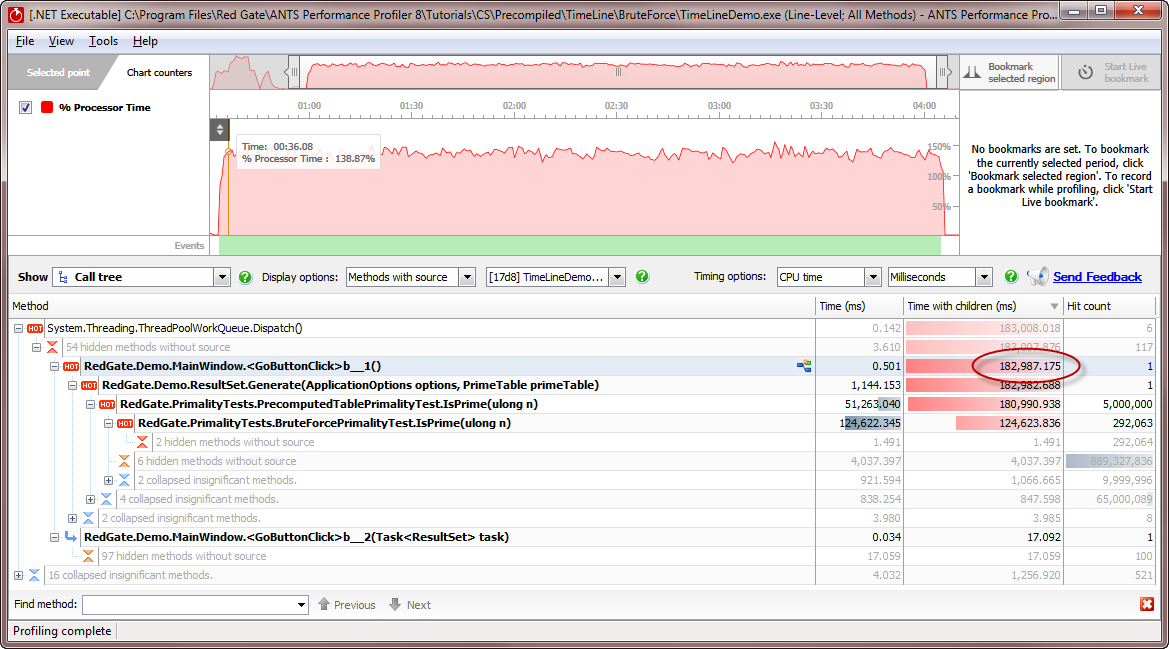
- Looking further down the call tree, the
IsPrime()method is being called a very large number of times. - We can take a look at the method that's taking so long. Right-click a method you're interested in, and select Open with new instance of Visual Studio.
Visual Studio opens, showing the line of code that's taking so long. - If you're interested in investigating the source code further, you can open it from %Program Files%\Red Gate\ANTS Performance Profiler 8\Tutorials\CS\Demos\TimeLineDemo\TimeLineDemo.csproj
Now we've tried the brute force method, let's see if using the Miller-Rabin algorithm works any better.
- In ANTS Performance Profiler, on the File menu, click New Profiling Session.
If a warning dialog comes up, click Continue Anyway. - On the main ANTS Performance Profiler page, click New profiling session.
- Change the .NET executable to the Miller-Rabin build of TimeLineDemo.exe.
This is found in %Program Files%\Red Gate\ANTS Performance Profiler 8\Tutorials\CS\Precompiled\TimeLine\MillerRabin\ - Click Start Profiling.
If an elevation permission dialog opens, grant permission. - TimeLineDemo starts and goes through the initialization phase.
- In TimeLineDemo, click the ANTS Performance Profiler logo to open the Configuration dialog.
- Set MaxRandom to 2000000000 and SampleSize to 5000000, then click OK.
- In the main application window, click Go.
- Select the calculation phase on the timeline, as you did earlier.
- It looks like the Miller-Rabin algorithm is much faster - in this screenshot, the calculations took 64,071 milliseconds, about 65% faster than brute force
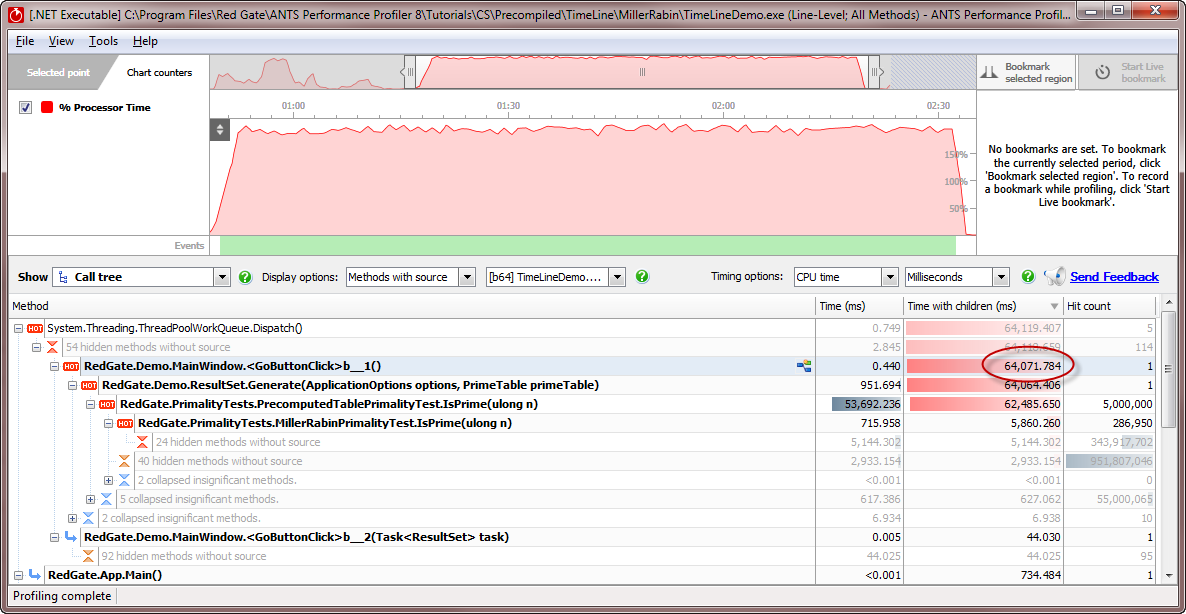
So for large numbers, Miller-Rabin is faster than brute force. But is true for smaller numbers too?
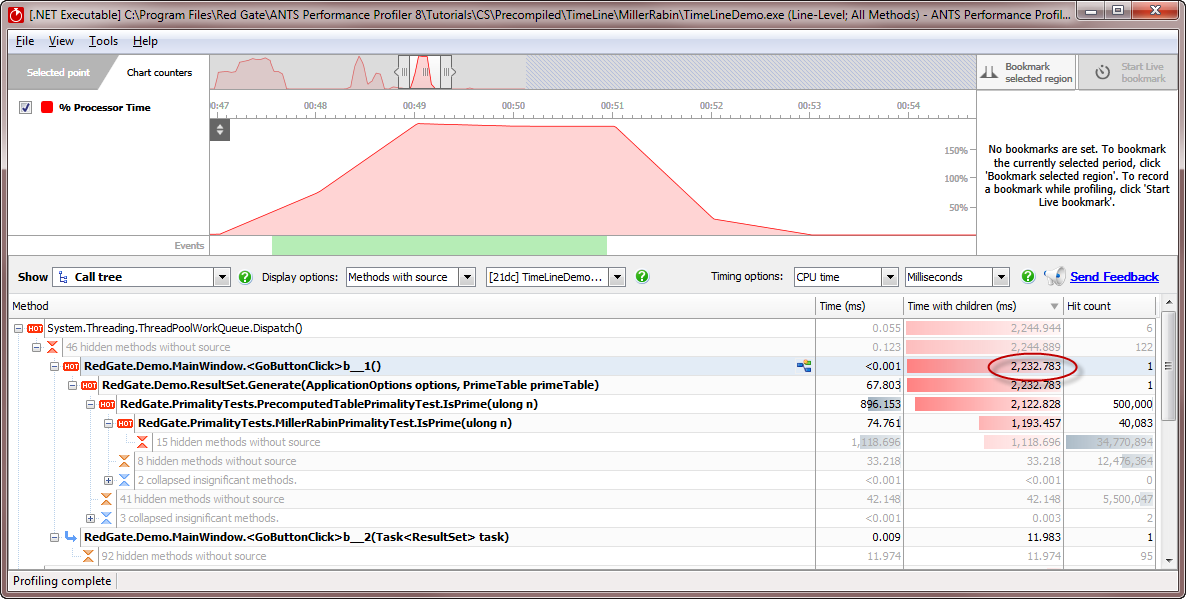
- Profile TimeLineDemo again, but this time, set MaxRandom to 500000 and SampleSize to 500000 - the same as the first time we profiled the brute force algorithm.
- These calculations took 2,232 milliseconds - almost twice as long as it took the brute force algorithm. So for smaller numbers, Miller-Rabin is slower than brute force.
Learning more
To perform the task in this worked example more efficiently, you can use the following:
- To help you identify the section of the timeline to select, you can refer to the Event markers in the Events bar.
- You can name and bookmark sections of the timeline.
For more information, see The timeline.
This documentation contains proprietary information and is protected by copyright law.
Copyright © 2026 Red Gate Software Limited. All rights reserved


