Integrated decompilation
Published 14 May 2018
Integrated decompilation is only available in ANTS Performance Profiler Professional edition.
You cannot decompile methods if you're profiling a .NET 1.1 application.
Integrated decompilation is powered by the .NET Reflector engine, but you don't need .NET Reflector installed to use integrated decompilation.
You can decompile methods without source directly from the call tree. Decompiling a method generates line-level code from any .NET assembly. This allows you to identify the causes of performance problems in previously inaccessible code, for example, third-party components or legacy assemblies called by your application.
Decompiling a method from an assembly with no PDB
- In Display Options, select All methods to view methods without source:
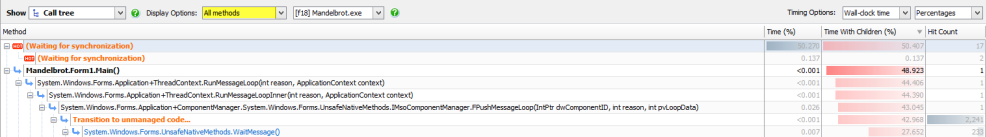
- In the call tree, select a method without source code (shown in the call tree in plain, unbolded text):
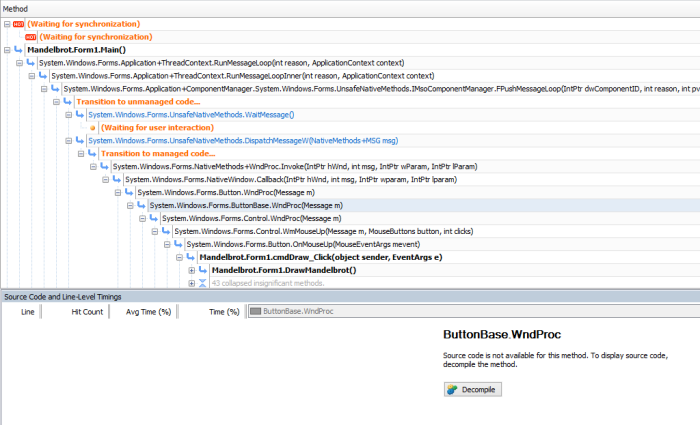
- Click
 to generate source code for the selected method, or on the View menu, click Show Source View.
ANTS Performance Profiler now decompiles the selected method, and displays automatically-generated source code for the selected method in the source-code pane.
Without a PDB file, line-level timings are unavailable and only method-level timings are shown.
For more information on navigating your decompiled source, see Source code.
Decompiling a method from an assembly with a PDB
- In the call tree, select a method from an assembly for which you have a PDB but no source code (shown in the call tree in plain, unbolded text).
- Click to generate source code for the entire assembly.
ANTS Performance Profiler will decompile the selected assembly or method, and display automatically-generated source code for the selected method in the source-code pane. If you chose Line-level and method-level timings; only methods with source or Line-level and method-level timings; all methods inc. framework profiling mode, ANTS Performance Profiler will match these timings to the decompiled code, though the timings may be inexact.
For more information on navigating your decompiled source, see Source code.
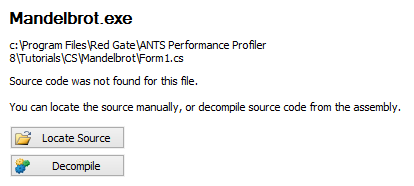
Methods will also display without source if you have the assembly's source code but ANTS Performance Profiler cannot automatically locate it. To manually specify a path to the source code for an assembly, click 
Decompiling Silverlight applications
Code from Silverlight browser applications embedded using Javascript cannot be decompiled.
Note: Silverlight support was removed in ANTS Performance Profiler 10.1.
Silverlight browser applications embedded using HTML can be decompiled if ANTS Performance Profiler can locate the associated XAP file. For information on configuring your Silverlight application so that ANTS Performance Profiler can find the XAP file, see How to: Add Silverlight to a Web Page by using HTML (MSDN).
If ANTS Performance Profiler cannot find the XAP file automatically, the message "Could not identify a file path" will be displayed.
To manually specify the path to the XAP file, on the settings screen:
- From the list of application types, click Silverlight 4+ application.
- For the Silverlight application URL, enter the path to the XAP file (rather than to the website).
Code from Silverlight out-of-browser applications can also be decompiled if the profiled application is configured to work as an out-of-browser application.
Decompiling obfuscated code
Some obfuscated code cannot be decompiled, or can be decompiled only partially. Partially obfuscated code, when decompiled, may display mangled method names and absent lines of code.
If an obfuscated method cannot be decompiled, the method's contents are replaced with the comment "This code is obfuscated and can not be translated" in the source code pane.
Saving profiling results
When saving profiling results, any decompiled code generated during the profiling session is not saved. To view source for methods from third-party assemblies on opening a saved session, follow the decompilation steps above.
This documentation contains proprietary information and is protected by copyright law.
Copyright © 2026 Red Gate Software Limited. All rights reserved


