Profiling Azure Functions (Core Tools)
Published 05 November 2026
You can profile a C# function app on your own machine, while it runs under Azure Functions Core Tools. This is the same way Visual Studio runs it when you press F5.
You can't profile functions that are deployed to Azure.
Before you start
You need:
- Azure Functions Core Tools v4. It's installed with the Azure development workload in Visual Studio. You can also install it with npm or the Microsoft installer.
- The .NET SDK that your function project targets.
- The function project folder. This is the folder that contains
host.json.
Setting up the session
- On the startup page, click New profiling session.
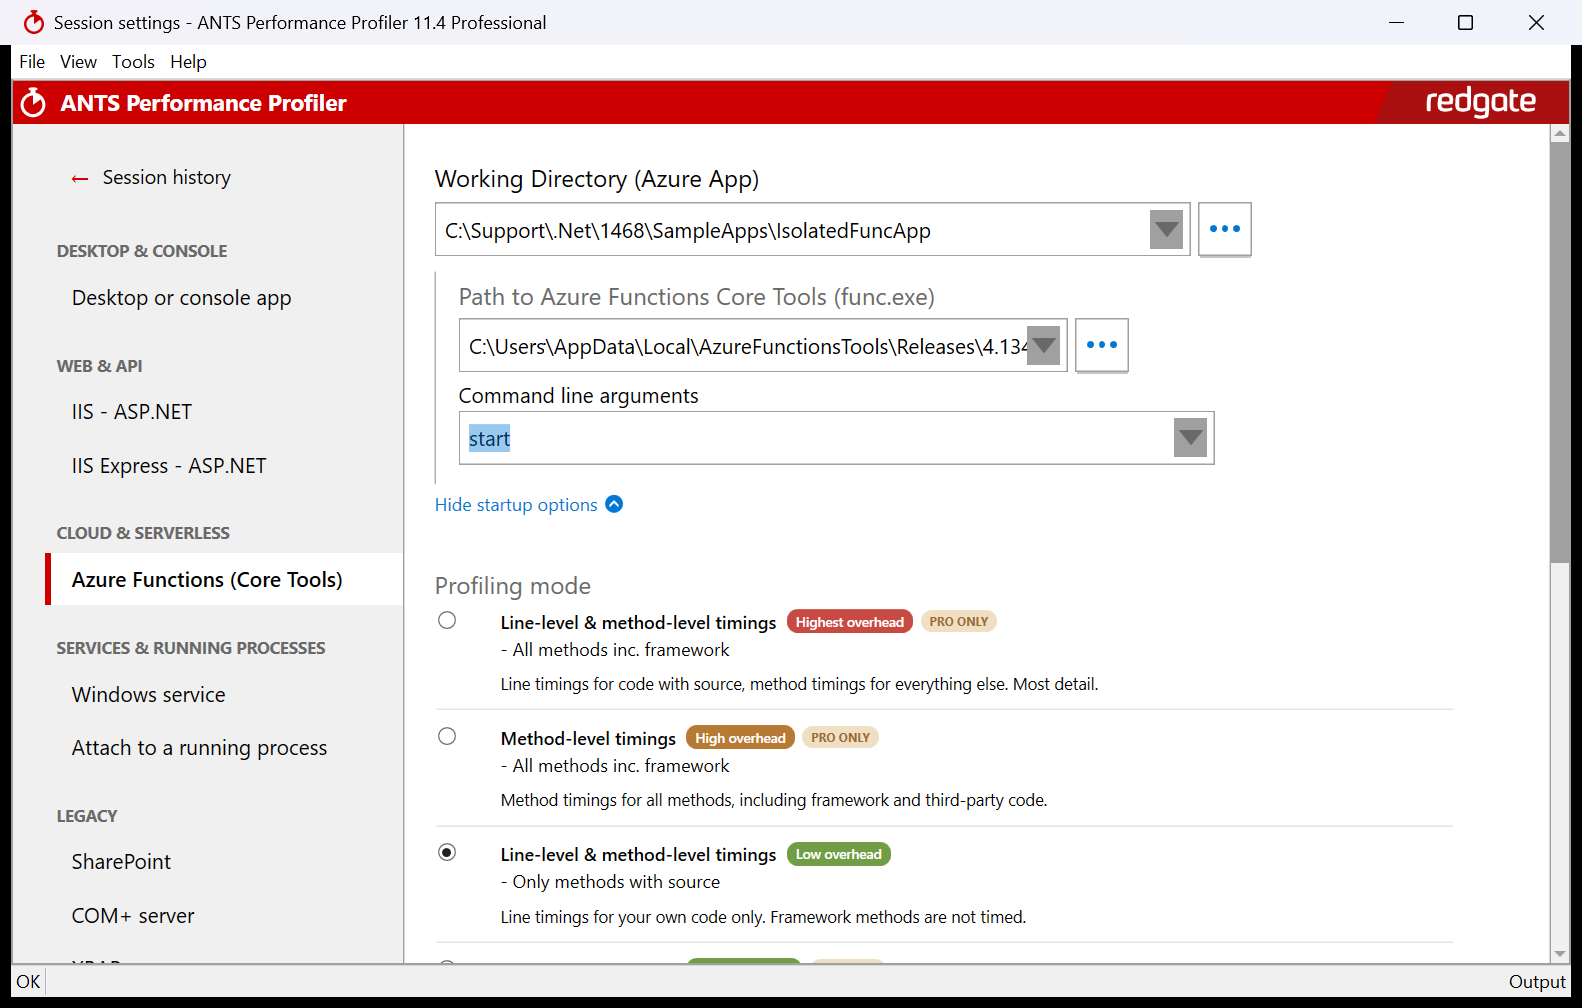
- Under Cloud & serverless, select Azure Functions (Core Tools).
- In Working Directory (Azure App), select your function project folder.
- Check Path to Azure Functions Core Tools (func.exe).
ANTS Performance Profiler normally fills this in automatically. It first looks for a cached Core Tools build that matches your project type,
isolated or in-process. If no matching cached build is available, it searches PATH, standard npm installation locations, and the standalone Core Tools installation directories.
To use a different Core Tools installation, click ... and browse to func.exe. - Optionally, click Show startup options and change Command line arguments. The default is
start.
For example, usestart --port 7072if port 7071 is already in use. - Choose a profiling mode and any other options, then click Start profiling.
What happens when you start profiling
- Your function project is built (
dotnet build). The build isn't profiled. - func.exe starts your function app and the profiler attaches to it.
- When the host is ready, call your functions as normal. For example, for an HTTP trigger, open
http://localhost:7071/api/<FunctionName>in a browser. - When you've finished, click Stop profiling. func.exe and the worker process are stopped.
Finding your code in the results
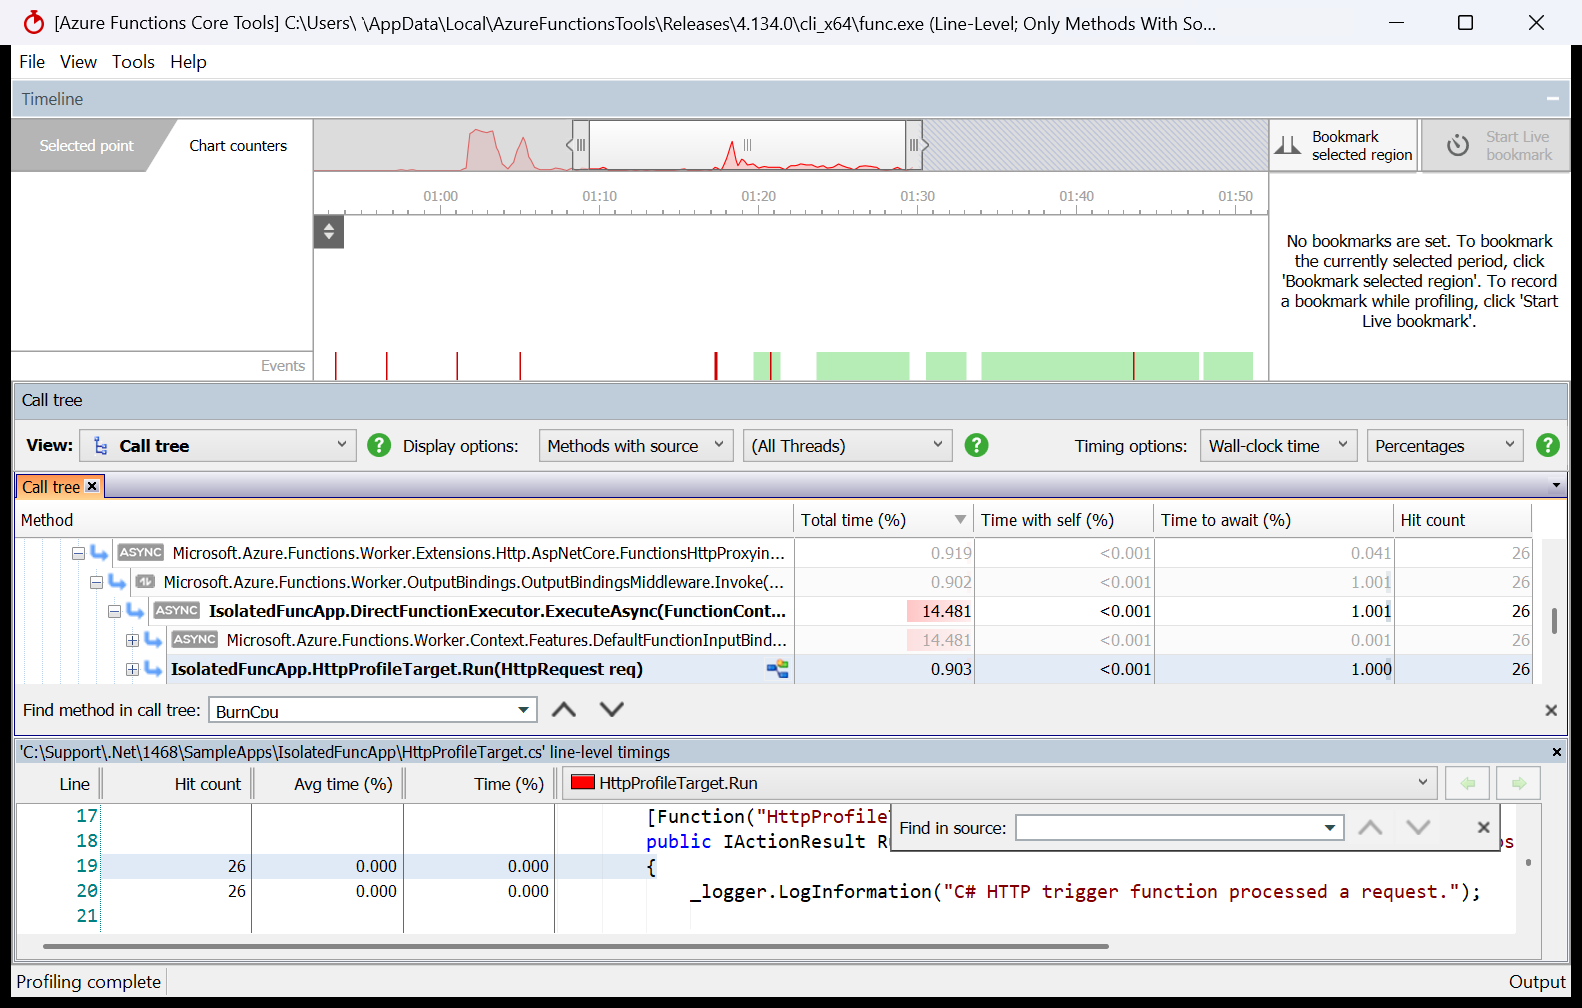
Your functions appear in the call tree with the rest of your code. For isolated function apps they run in a separate worker process (dotnet.exe), which is included in the results.
To jump to a function, type its name in Find method in call tree.
If profiling doesn't start
| Message or problem | What to do |
|---|---|
| The function project failed to build. | Fix the build errors shown, then start profiling again. |
| Port 7071 is already in use. | Stop the other function app, or add --port <number> to the command line arguments. |
| Couldn't run 'dotnet build'. | Install the .NET SDK and make sure dotnet is on the PATH. |
| Start profiling is greyed out. | Check that the working directory contains host.json and that func.exe exists. |
This documentation contains proprietary information and is protected by copyright law.
Copyright © 2026 Red Gate Software Limited. All rights reserved


