Async in the call graph
Published 14 May 2018
In the call tree, the profiler has an Async mode, which simplifies the call tree so it reflects the code you wrote, rather than the actual implementation of async by the .NET CLR. For more information, see Async in the call tree.
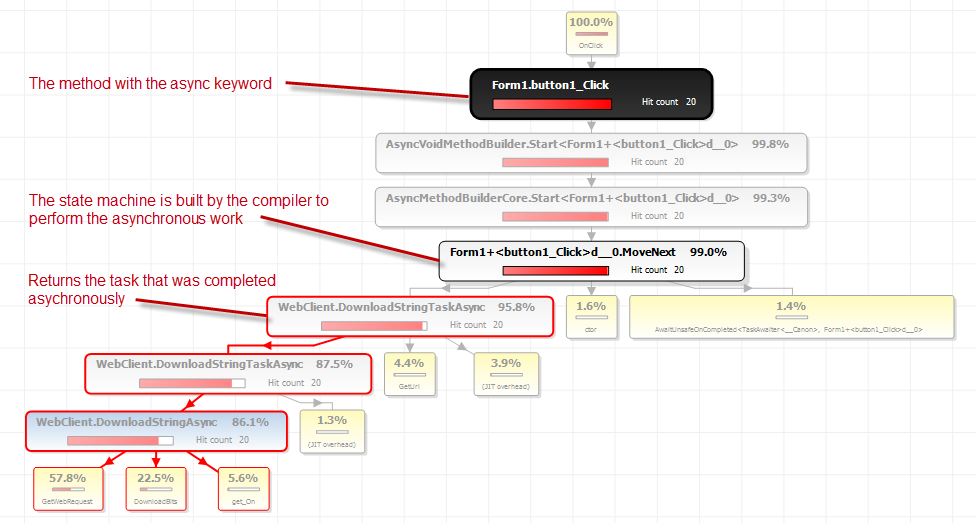
The call graph is intended to show the relationships between methods diagrammatically, so it wouldn't make sense to rearrange the nodes. Therefore, the call graph always shows accurately how the state machine executes the async code, without the simplification shown in the call tree with Async mode enabled.
You can disable Async mode so that the representation shown in the call graph matches the hierarchy shown in the call tree. On the View menu, deselect Async Mode.
In the example below, the complexity of async is hidden by the call tree in Async mode:
In reality, the compiler creates a state machine to perform the asynchronous work, which is represented by the MoveNext() method. Note how the child of MoveNext() is DownloadStringTaskAsync(), which is a framework method that returns a task that was completed asynchronously, not the code we actually wrote:
If the asynchronous task has more than one continuation, there may be also other MoveNext() methods in other stacks, not shown in the call graph.
For a key to the various colors shown in the call graph, see The call graph.


