Advanced options
Published 11 June 2013
Unless you have a particular need to adjust the Advanced Options, we recommend leaving them at their default settings. Changing the default setting for certain options may cause problems during profiling.
ANTS Performance Profiler has options that are applied to all profiling sessions.
To access these options, on the Tools menu, click Advanced Options.
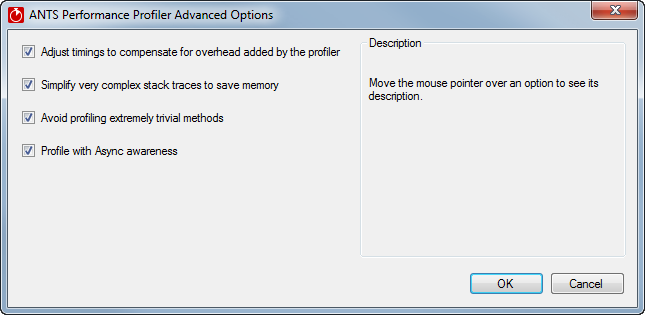
The ANTS Performance Profiler Advanced Options dialog box is displayed:
If you have been using ANTS Performance Profiler version 7.x (or earlier) you may notice that the options to include source code with saved results, and to enable inlining are no longer on this dialog. You now set these options when you set up a profiling session.
Adjust timings to compensate for overhead added by the profiler
Adjusts timings by estimating the influence the profiler has had on the process being profiled, and subtracts this from the profiling results. This estimate is most accurate when you use a profiling mode that does not collect line-level timings.
The design of modern processors means that this estimate may not always be accurate, especially for short function calls.
By default, this option is selected.
Simplify very complex stack traces to save memory
Summarizes complex stack traces in profiling results. This conserves resources on the machine you are using for profiling. The stack traces that are summarized are unlikely to be important to your profiling results. However, if you wish to see these summarized results, you can clear this option.
Clearing this option can significantly increase the memory required by the profiler. Depending on the application you are profiling, the profiler may become unstable if you clear this option.
By default, this option is selected.
Avoid profiling extremely trivial methods
Prevents profiling of methods that have a running time measured in tens of nanoseconds, and which contribute to less than one-billionth of the run time in total. Typically, these methods do not produce very relevant performance data. Ignoring these methods reduces the amount of memory required to store and process profiling results.
Note that these extremely trivial methods are not the same as Trivial Methods in Windows Store applications.
By default, this option is selected.
Profile with Async awareness
This option is available in ANTS Performance Profiler 8.2 and later.
Analyzes code for the .NET 4.5 async / await pattern during profiling. Most users should leave this option enabled but you can disable it if you experience problems when profiling asynchronous code.
By default, this option is selected.


