Profiling a COMplus server application
Published 11 June 2013
Profiling a COM+ server application requires a little more setup than some types of profiling session. You specify the location of the application, any options, and your desired profiling mode as normal. But you may need to make changes on the COM+ server to enable profiling, or work around this if you don't have access to the server.
To profile a COM+ server application correctly, there are two main steps:
- Change the COM+ server so that it can be profiled.
- Set up ANTS Performance Profiler.
Changing the COM+ server so that it can be profiled
ANTS Performance Profiler can only profile COM+ server applications which are activated in a process provided by the system, not by the client. To do this, set the ApplicationActivation attribute as follows:
[assembly: ApplicationActivation(ActivationOption.Server)]
If you can't set this attribute (for example, if you don't have access to the source code), you may still be able to profile the COM+ application by profiling the client application.
However, if you use this workaround, be aware that:
- the resulting server application will not be a true COM+ application and will run in the client process
- ANTS Performance Profiler will profile the client application, and will treat the COM+ server as a DLL invoked by the client.
Your profiling results may therefore be less realistic.
Setting up ANTS Performance Profiler
To profile COM+ server applications, on the settings screen:
- From the list of application types, click COM+ server.
- Use the dropdown list to select the COM+ server application you want to profile.
Click to update the list of COM+ server applications.
 - If you want to profile a client application's communications with the COM+ server:
- Click Show startup options and browse to the client application Executable.
- If you need to specify any command line arguments to be used when running the client application, specify them in the Command line arguments box:
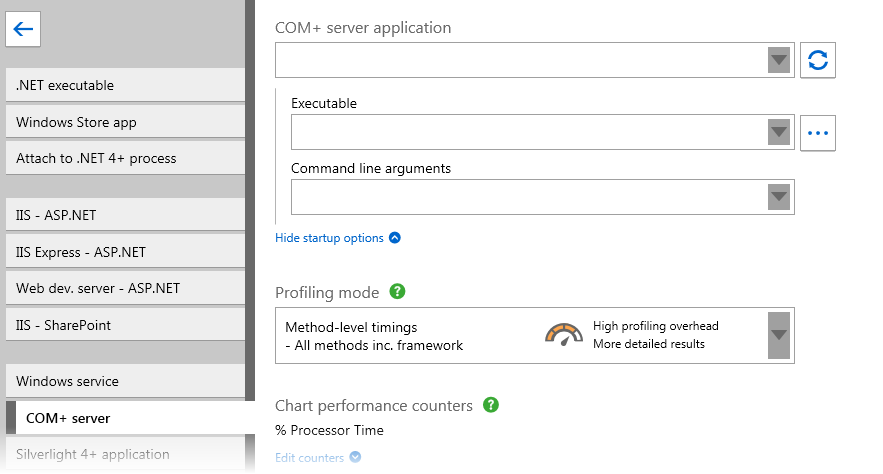
- Select the required Profiling mode, Chart performance counters, Additional profiler options, and the browser to launch the application.
For more information, see Working with application settings and Setting up chart performance counters. - Click

If you specified a client application, it starts. If you did not, you may need to start it manually.
During a profiling session you can interact with the client application while your COM+ server is still being profiled.
When you have finished interacting with your client application, and you are ready to finish profiling the COM+ server, click the  button in ANTS Performance Profiler to stop profiling.
Profiling remote COM+ applications
The security architecture of COM+ does not allow COM+ applications to be started from a Remote Desktop session with a GUI, or a terminal services session.
To profile COM+ applications remotely, type mstsc /console at a command prompt to start a Remote Desktop session in console mode.
All users who are logged on to the computer that you are connecting to will be logged off when you connect.
Troubleshooting
Some COM+ server applications need to be fully trusted before being profiled. If profiling the COM+ server does not work, you may need to make the application's code fully trusted by setting the ApplicationAccessControl attribute as follows:
[assembly: ApplicationAccessControl(false)]
You should not normally release the COM+ application in this trusted state.
This documentation contains proprietary information and is protected by copyright law.
Copyright © 2026 Red Gate Software Limited. All rights reserved


