Using the Visual Studio add-in
Published 11 June 2013
The ANTS Performance Profiler Visual Studio add-in allows you to:
- Launch ANTS Performance Profiler from your IDE
- Switch straight to your source code from ANTS Performance Profiler
Version 2 of the add-in supports Visual Studio 2010 and later.
If you installed your .NET Bundle before July 17th 2014, you have version 1 of the ANTS Profiler add-in, which also supports Visual Studio 2005, 2008 and 2008 R2. This will be replaced by version 2 of the add-in the next time you install ANTS Performance Profiler or ANTS Memory Profiler.
Launching ANTS Performance Profiler from Visual Studio
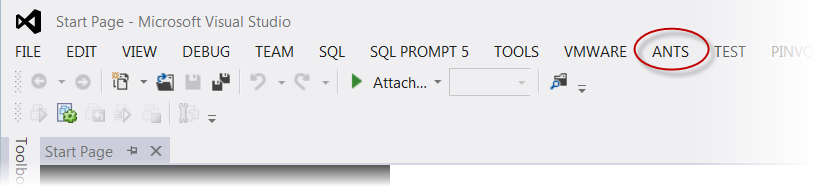
Installing the add-in adds a new ANTS menu in Visual Studio. If you also have ANTS Memory Profiler installed, both profilers will be available under this menu.
Build your solution in Visual Studio, then on the ANTS menu, select Profile Performance to profile the build.
If you use Visual Studio 2010, you cannot start profiling web applications in IIS Express from the ANTS Visual Studio add-in. You must use Visual Studio 2012 to start profiling applications in IIS Express from the add-in.
Switching to your source code from ANTS Performance Profiler
To identify classes with source code, you must ensure that the .pdb file is in the same directory as the application. For more information, see Troubleshooting PDB problems.
You can switch to source code from the call tree or the methods grid. In both views Classes with source code are shown in bold.
To search for your class's namespace, on the Tools menu, click Find.
Right-click a class with source code to show the context menu.
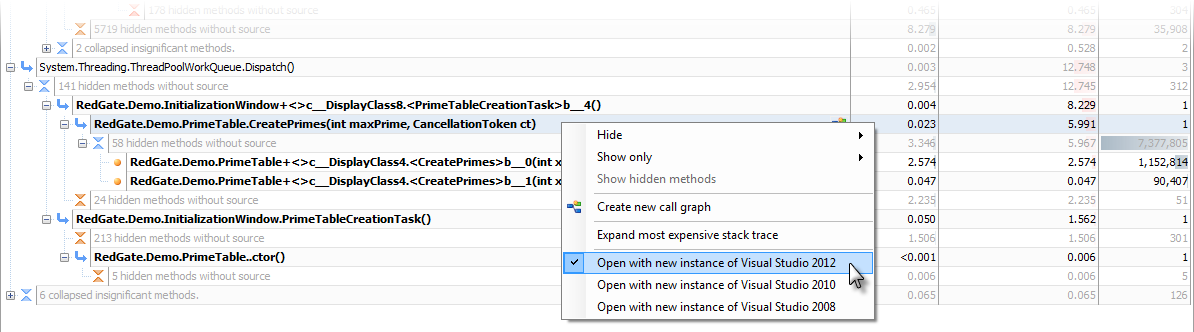
To open only the source code associated with that class, select Open with new instance of Visual Studio 20xx.
It is often more useful to open the source code inside its solution. To do this, open the solution in Visual Studio. Return to ANTS Performance Profiler and open the context menu. On the context menu, select Open with (Solution Name) - Microsoft Visual Studio (Visual Studio 20xx).
Troubleshooting
- If the path to the source code in the .pdb file is invalid, the class is still shown in bold, but the context menu does not display the Visual Studio options. Recompile the application on the computer you are using to profile it.
- If the solution was opened with elevated privileges (Visual Studio is running as administrator), the option for opening the source code inside the solution might not be shown. Restart Visual Studio under the same credentials as ANTS Performance Profiler.
- The Visual Studio add-in is a separate program from ANTS Performance Profiler, and is installed by default as part of Redgate's .NET bundles. If you purchased ANTS Performance Profiler as a standalone product, you might not have the add-in. In that case, download the add-in by searching for ANTS Profiler add-in in the Visual Studio gallery. You do not need a new license for the add-in, and the add-in will not expire when the bundle's trial period ends.
- If you see two ANTS menus in Visual Studio, this is because version 1 of the add-in couldn't be removed when version 2 was installed. To remove version 1 manually, use Uninstall or change a program in Control Panel.
Installing the Visual Studio add-in in Visual Studio 2014 CTP
You can't install the Visual Studio add-in in Visual Studio 2014 CTP from the Redgate .NET bundle installer.
To install ANTS Profiler add-in version 2 in Visual Studio 2014 CTP, install the add-in from Extensions and Updates in Visual Studio, or by searching ANTS Profiler add-in in the Visual Studio gallery.
Visual Studio 2014 doesn't support version 1 of the Visual Studio add-in.
This documentation contains proprietary information and is protected by copyright law.
Copyright © 2026 Red Gate Software Limited. All rights reserved


