Working with the Outgoing HTTP Requests view
Published 11 June 2013
You can also switch to Outgoing HTTP requests view from the call tree by clicking the icon for the request:
Outgoing HTTP Requests view is only available in ANTS Performance Profiler Professional edition.
If you are profiling in 'Method-level timings - Only methods with source' mode, the hit count in Outgoing HTTP Requests view might be incorrect. If you encounter this problem, switch to 'Line-level & method-level timings - All methods inc. framework' mode.
The hit count can also be wrong if the currently-selected period in the timeline does not include the start or the end of the request. Ensure the selected period includes the whole time for the request you are interested in.
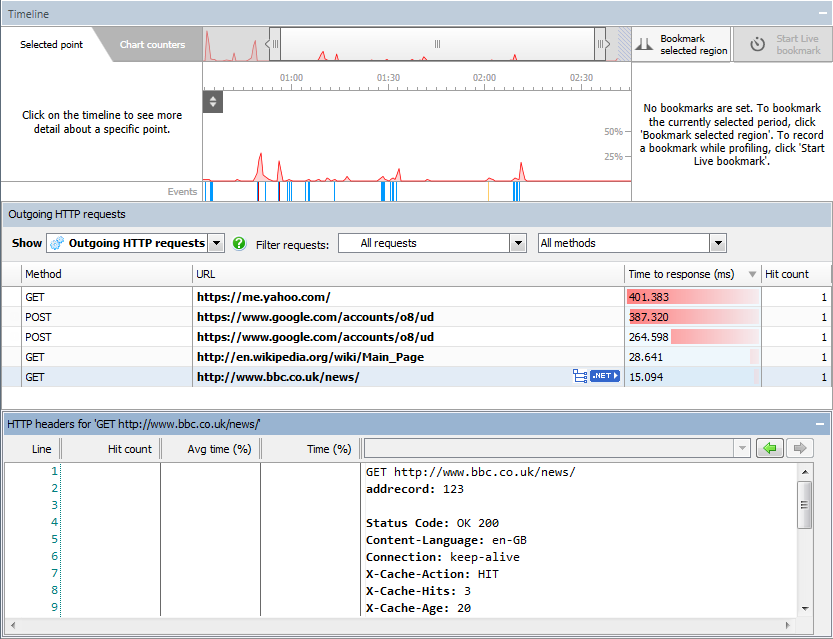
The Outgoing HTTP requests view shows performance data for all the outgoing HTTP requests your application made during the selected time period:
Outgoing HTTP requests are recorded for applications that run on IIS, IIS Express, or the Web Development Sever.
If your application makes multiple requests to the same URL, each request is shown separately in the outgoing HTTP requests view.
The following data is shown for each URL, for the time period you have selected:
- Method
The HTTP method your application requested. GET and POST methods are displayed. All other types of HTTP methods are displayed as 'OTHER'. - URL
The URL requested by your application. - Time to response
The time (in milliseconds) taken to receive a response to the outgoing HTTP request.
When you select an HTTP request in either the Call Tree or the requests from client view, it's highlighted with green shading in the events bar so that you can see where the request occurred on the timeline. The lower pane shows the request and response headers for the selected HTTP request.
Outgoing HTTP requests that failed to receive a response will be shown in red text in the outgoing HTTP requests view, with a icon to the left of the Method column. Successful requests are shown in black text.
If your application made an HTTP request during the currently selected region of the timeline, the time to response will be correct even if the response was not received by your application until after the currently selected time period. For more information about the timeline, see Working with the timeline
Filtering outgoing HTTP requests
You can filter the results shown in the outgoing HTTP requests view using the Filter requests dropdown menu:
The first dropdown menu allows you to show All requests, Successful requests only or Failed requests only.
The second dropdown menu allows you to show All methods that your application requested, GET methods only or POST methods only.
Linking back to your code
To find out which methods were called on the server when a particular URL was requested:
- In outgoing HTTP requests view, select the URL.
A icon is displayed on the right hand side of the URL column. - Click
The display switches to the call tree view, with the outgoing HTTP request selected.
Methods invoked by the outgoing HTTP request are shown below it in the call tree, with timing data that can be used to determine whether performance problems are associated with the outgoing HTTP request.
Finding particular requests in the outgoing HTTP requests view
- On the Tools menu, click Find.
The Find bar is displayed beneath the outgoing HTTP requests view. - Type all or part of the URL you are looking for.
The URLs are filtered to display those that match your text.


