What's new in ANTS Performance Profiler 8.0
Published 28 August 2014
What's new in version 8.0?
New startup screen
One of the first things you'll notice is the new startup screen in ANTS Performance Profiler 8.0. We've aimed to make it easier to set up your application for profiling and to choose the most suitable profiling mode:
| ANTS Performance Profiler v7.4 | ANTS Performance Profiler v8.0 |
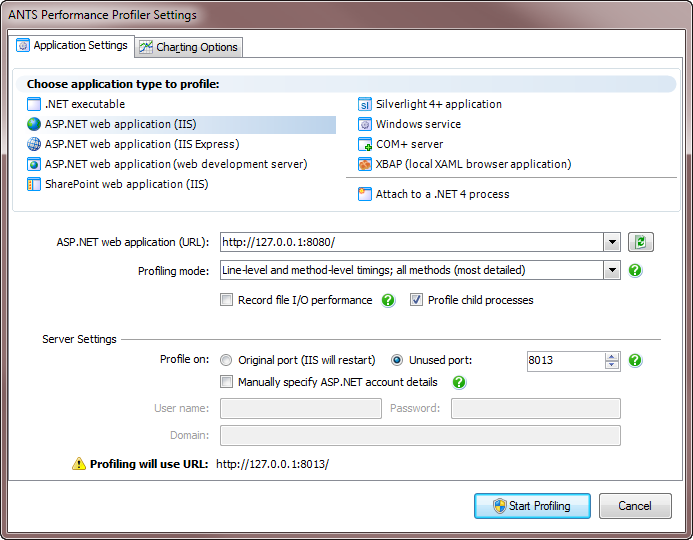 | 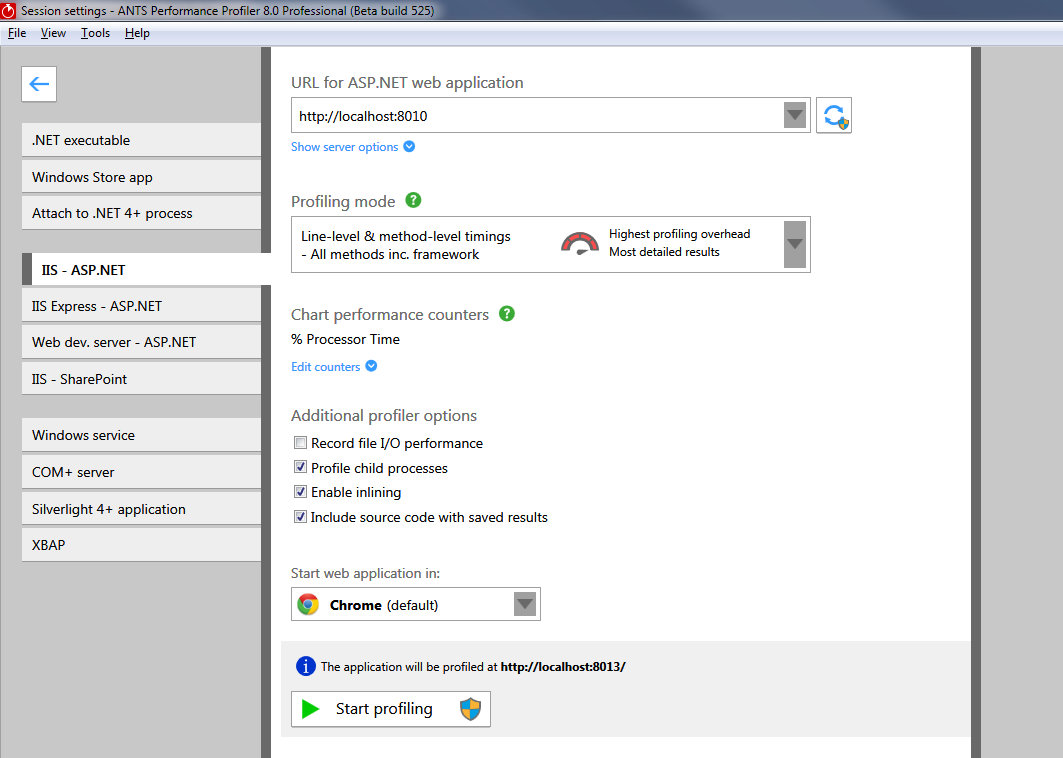 |
The settings you need depend on your application but we've tried to make them as intuitive as possible in the new design. If you do have problems, see Choosing application types and settings.
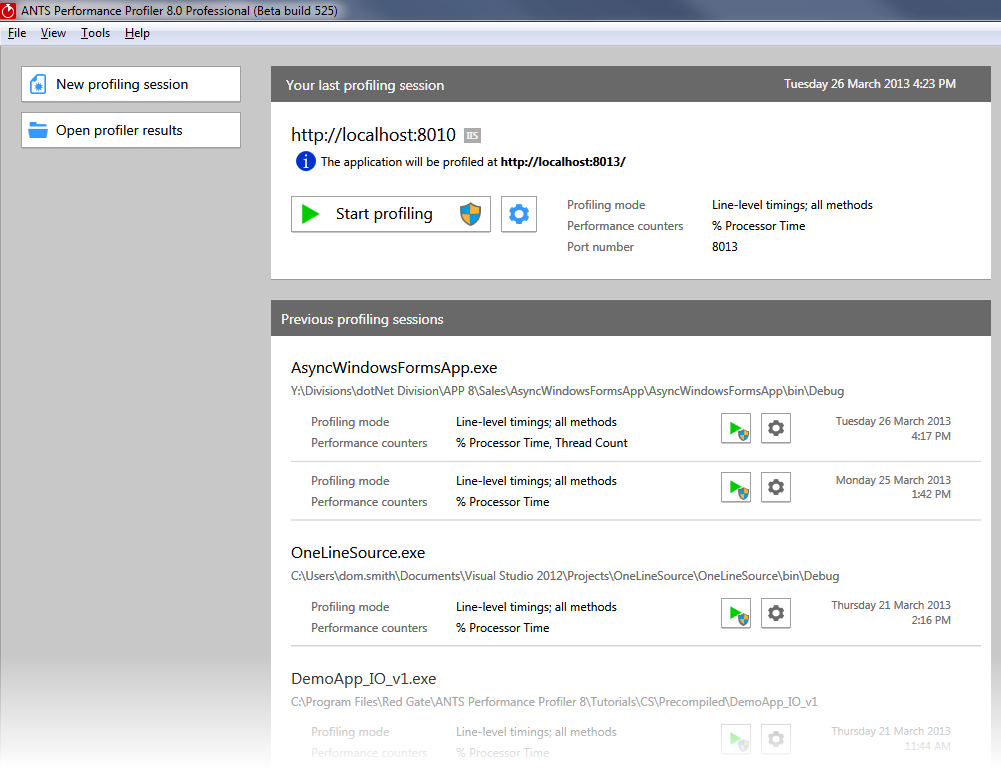
Once you've set up your applications for profiling, you can now profile them on subsequent occasions with just one click, as we've added a history of your previous sessions:
New timeline
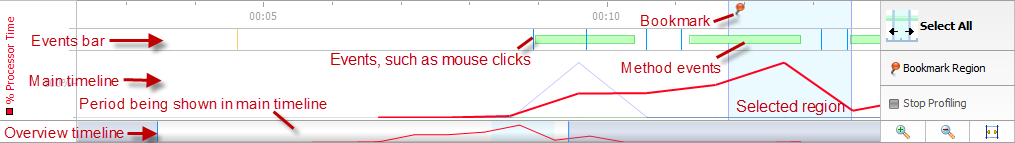
The timeline has been completely redesigned too:
ANTS Performance Profiler v7.4:
ANTS Performance Profiler v8.0:
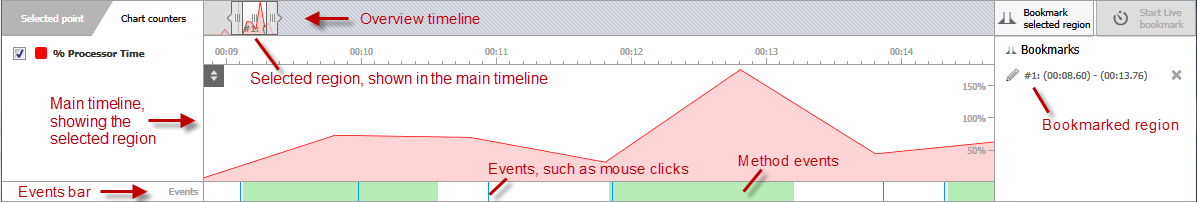
The main difference is that the selected region is always the area shown in the main timeline. You can select regions by dragging to select an area in the main timeline or by dragging the handles in the overview timeline.
We've added the ability to create Live bookmarks. Live bookmarks may be useful if you know that your performance problem is caused when you perform a certain action, like opening a particular dialog box.
During profiling, click Start Live bookmark before you open the dialog box then stop the Live bookmark when the problem has exhibited itself. You'll now have a region saved on the timeline you can refer back to later.
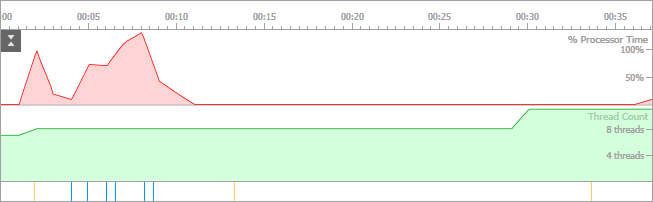
If you have chosen to collect data from multiple performance counters, you can use the new Split graph button (  ) to separate the graphs in the timeline:
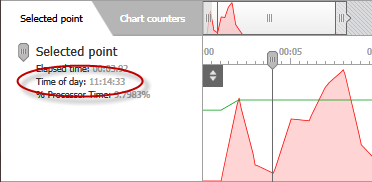
One of the features we're regularly asked for is the ability to see at what time a problem occurred, especially if you've left a profiling session running overnight to find an elusive problem. To do this, click at a point on the timeline. The Time of day, according to your computer's system time, is shown on the Selected point tab:
Finally, if you're looking for the Stop profiling button, we've moved it a bit, and it's now only shown during profiling:
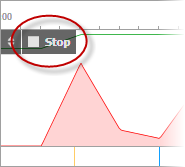
If you're profiling a web application, you now have to use the Stop profiling button. Closing your web browser will no longer stop the session.
For more information, see Profile websites and webservices in a choice of browsers.
For more information, see The timeline.
Support for the async keyword in C# 5
Since ANTS Performance Profiler 7.4, C#5 has been released, which includes the new async and await keywords that are supported by .NET 4.5.
We've worked hard to try to make asynchronous method calls appear logically in the call tree, by hiding the complexity of the state machine to show results similar to your code. The result of this work is Async mode, which is enabled automatically when the period selected on the timeline includes async. If you don't want to see the simplified view you can disable Async mode on the View menu.
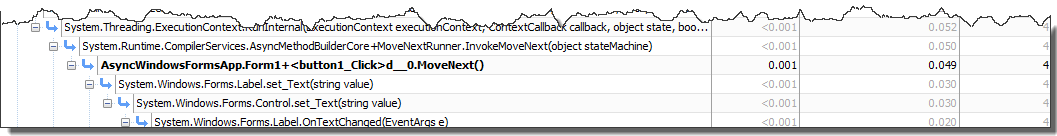
ANTS Performance Profiler 8.0 in Async mode:

Notice how the internals of the state machine have been hidden (there's no MoveNext() method shown, for example) and the continuation (Label.set_Text()) is shown as a child of button1_Click().
ANTS Performance Profiler 7.4 / ANTS Performance Profiler 8.0 with Async mode disabled:

Notice that there are two MoveNext() methods in different parts of the call tree, representing how the asynchronous method really executed. The continuation, Label.SetText(), is shown as a child of the second MoveNext(), which is not a child of the button1_Click() method.
- The Call Graph does not have an Async mode and so shows the internal methods called during async operations.
- Integrated Decompilation does not support async in v8.0, and so attempting to decompile an async method will result in decompiling the state machine, rather than just seeing the async keyword.
- Async in VB11 is not supported by Async mode.
For more information, see Async in the call tree and Async in the call graph.
Profile websites and webservices in a choice of browsers
When you profile an application in IIS, IIS Express, Web Dev Server or SharePoint, you can choose to start the application in any recognized browser you have installed on your computer.
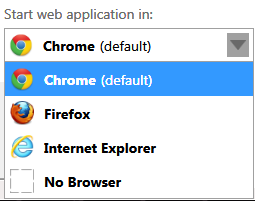
In ANTS Performance Profiler 7.4, you had to start the application in Internet Explorer.
When profiling Silverlight in-browser applications, you still have to profile the application in Internet Explorer. This is due to a technical limitation of Silverlight.
Allowing you to profile in any browser means that the profiler can no longer detect when you finish profiling by closing your browser. So, to stop profiling your application, you must click the Stop profiling button in ANTS Performance Profiler. (In ANTS Performance Profiler 7.4, you could just close Internet Explorer instead.)
If you are profiling a webservice and you use a client program to communicate with the webservice, you can choose No browser and start the application with the client program instead.
Profile HTTP web requests
In the call tree in ANTS Performance Profiler 7.4, HTTP requests from client programs to your application were grouped together. We called those requests Incoming HTTP requests:
ANTS Performance Profiler 7.4

In ANTS Performance Profiler 8.0, we have renamed that type of request as Requests from client:
ANTS Performance Profiler 8.0 - Requests from client
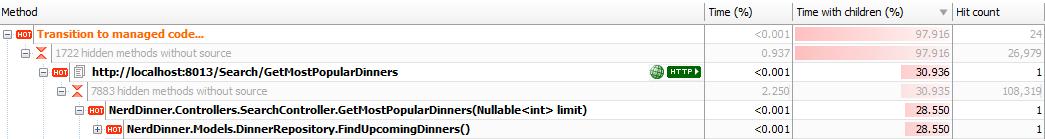
This is to distinguish these requests from the new type of profiling we've added, which lets you profile requests your application makes to other websites and webservices. These HTTP web requests could be the source of performance problems due to timeouts or excessive requests, for example:
ANTS Performance Profiler 8.0 - HTTP web requests

Click on ![]() to see the .NET method that caused this request.
to see the .NET method that caused this request.
When you select a web request, you can see the request headers sent and the response headers returned:
ANTS Performance Profiler 8.0 - HTTP headers
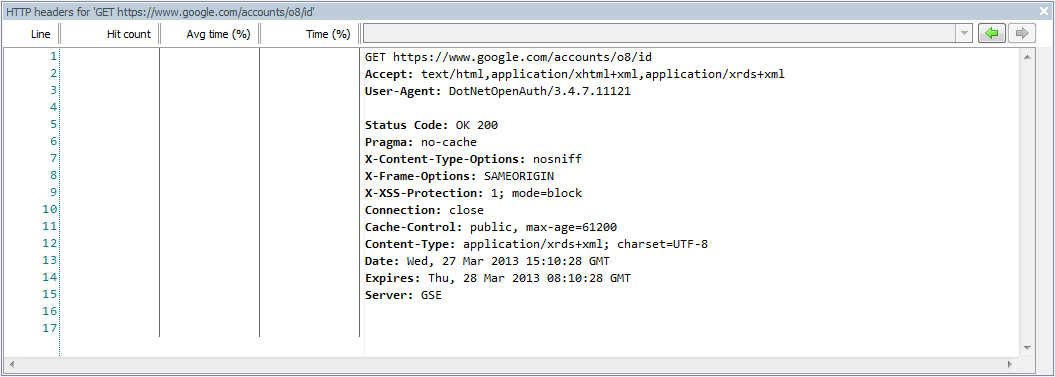
For more information, see Profiling web requests (HTTP requests).
Profile Windows Store apps
You can profile Windows Store apps in ANTS Performance Profiler 8.0.
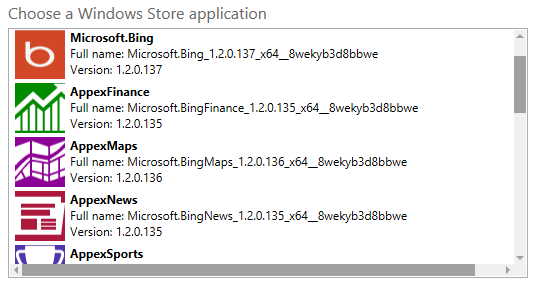
You can only profile Windows Store apps written in .NET (not Javascript). If your Windows Store app is written predominantly in Javascript but has dependencies in .NET, the profiler only shows results for the .NET parts.
Due to technical restrictions imposed by Windows Store apps, there are some limitations. For more information, see Profiling Windows Store (Windows RT) apps.
Profile SharePoint 2013 and IIS 8
ANTS Performance Profiler 8.0 adds support for SharePoint 2013 and you can profile web applications running on IIS 8.
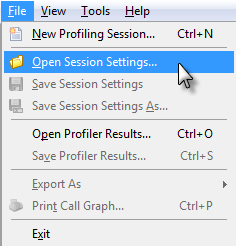
Session settings files
We've renamed 'Project files' to 'Session settings files' to make their purpose clearer. This is only a change in the name. You can still open project files from older versions of ANTS Perforrmance Profiler from the Open Session Settings... menu item.