Troubleshooting SharePoint Profiling
Published 28 August 2014
There are two main problems that you may encounter while profiling SharePoint:
- ANTS Performance Profiler can't read from the directory that SharePoint writes data to
- ANTS Performance Profiler can't profile SharePoint because of security restrictions in ASP.NET
ANTS Performance Profiler can't read from the directory that SharePoint writes data to
The most likely cause of problems while profiling Sharepoint is that ANTS Performance Profiler cannot read from the directory which SharePoint writes data to. To fix this:
- Create a temporary directory.
- If you are not on a sensitive system, allow full read/write access to this temporary directory to all users. If you are on a sensitive system, ensuring that the local system account has read/write access should suffice.
- Use the Control Panel to add a new environment variable. The variable must be called RGIISTEMP and the value is the path to the temporary directory you just created.
ANTS Performance Profiler can't profile SharePoint because of security restrictions in ASP.NET
Security features in ASP.NET may cause problems on some systems. To fix this:
- Obtain the required information
- Grant permissions
- Ensure that compilation with be in DEBUG configuration
- Copy PDBs and web part DLLs to the app_bin directory
1. Obtain the required information
Before you start, you need to know the following details for the site collection which you are profiling:
- the URL
- the TCP port
- the name of the primary site collection administrator
- the primary site collection administrator's password
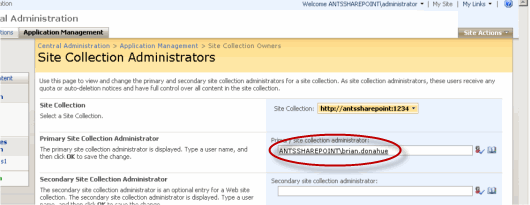
To find the name of the primary site collection administrator:
- Open the SharePoint Central Administration website using the Start menu item.
- Click the Application Management tab.
- Under the SharePoint Site Management heading, click Site Collection Administrators.
- Select the name of the site collection hosting your web part from the dropdown list.
- Make a note of the account set in the Primary Site Collection Administrator box.
2. Grant permissions
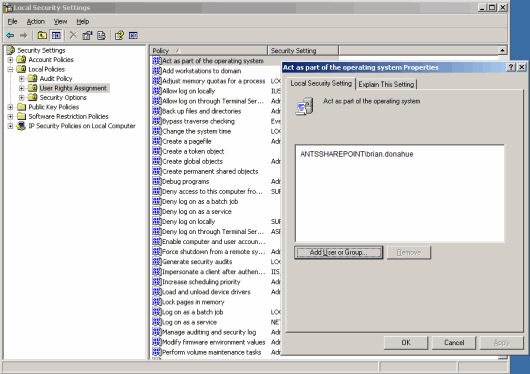
The primary site collection administrator must have permission to launch an IIS worker process. To grant this permission:
- Open Administrative Tools then open Local Security Policy.
- Under Local Policies, click User Rights Assignment.
- Double-click Act as part of the operating system and add the primary site collection administrator's account.
- Repeat steps 1 and 2, then double-click Impersonate a client after authentication and add the primary site collection administrator's account.
- Open a command prompt and run
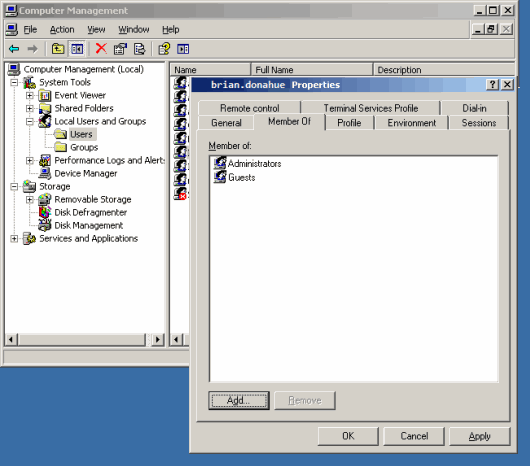
gupdate /forceto enforce the new settings. - Open Administrative Tools and go to Computer Management.
- Under Local Users and Groups, open Users.
- Double-click the primary site collection administrator's account and open the Member Of tab.
- Add the Administrators group.
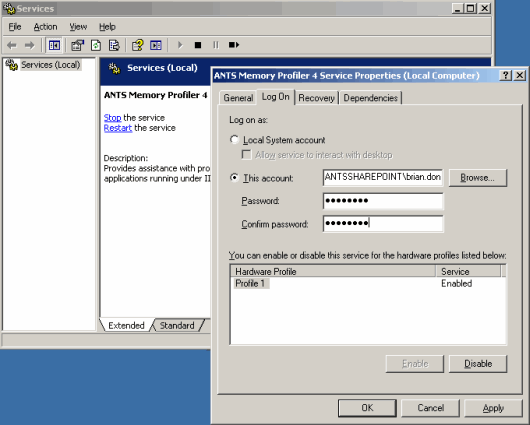
The ANTS Performance Profiler Service must use the primary site collection administrator's account when it starts. To configure this:
- Open Administrative Tools then open Services.
- Double-click ANTS Performance Profiler 8.x Service.
- Click the Log On tab.
- Select This Account and enter the primary site collection administrator's username and password.
- Click OK.
- If the status of ANTS Performance Profiler Service is Started, right-click the service and click Restart.
3a. Ensure that compilation will be in DEBUG configuration (IIS 7)
(Instructions for IIS 6 are below)
To set the application in DEBUG configuration in IIS 7:
- Load IIS Manager
- Click the web application you want to profile
- Click the .NET Compilation option
- Under the Behavior group, set Debug to True
Continue following the instructions in section 4 below.
3b. Ensure that compilation will be in DEBUG configuration (IIS 6)
To profile a SharePoint collection, the ASP .NET compilation must be done in DEBUG configuration. This will allow ANTS Performance Profiler to locate the source code for any web parts or other extensions you have written for the site collection. DEBUG configuration will also relax some unmanaged code restrictions that prevent profiling and stop the site from timing out.
To set DEBUG configuration, you must know the physical path to the root of the site collection website.
To find this path:
- Open Administrative Tools
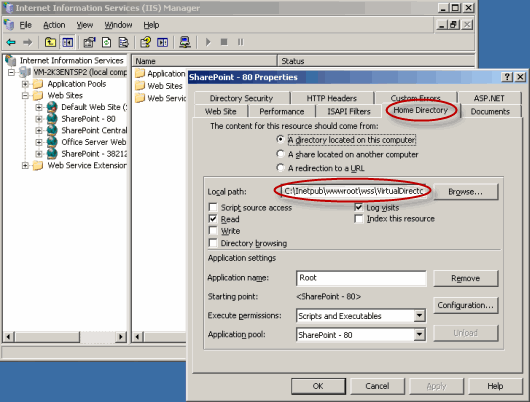
- Open Internet Information Server (IIS) Manager
- Right-click the website containing the site collection then click Properties
- Open the Home Directory tab
- Note the path in the Local path box
You must now locate and edit the web.config file for the site collection using an XML editor.
- Use Windows Explorer to navigate to the site collection root's physical path
- Right-click the web.config file
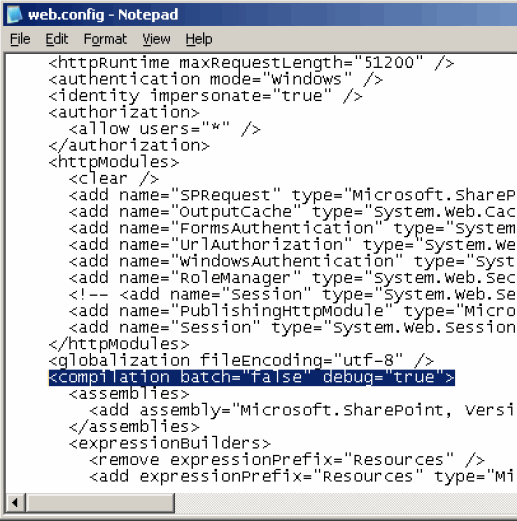
- Open the web.config file using Notepad. Search for the text debug
- Change
<compilation batch="false" debug="false">
to<compilation batch="false" debug="true">
and save the file.
4. Copy PDBs and web part DLLs to the app_bin directory
To filter out all methods except the ones run by your code when viewing the results, copy the relevant files into the site's app_bin directory:
- Copy all PDB files and any web part DLLs used by your site to the clipboard
- Use Windows Explorer to navigate to the site collection root's physical path
- Open the app_bin directory
- Paste all PDB files and any web part DLLs used by your site into this directory
Continue following the instructions to set up the profiler in Profiling SharePoint.
