DORA metrics
Published 29 September 2026
ENTERPRISE
Flyway Insights is in public preview for Flyway Enterprise users. Features may change before general availability. Got an idea or found a problem? Tell us what you think
Flyway Insights calculates industry standard DevOps Research and Assessment (DORA) metrics for your published database deployments automatically. There's nothing extra to configure. As soon as your deployments are showing in Flyway Insights, visit the Deployment metrics page at https://flyway.red-gate.com/metrics.
You can explore Deployment metrics in our sample projects at https://flyway.red-gate.com/metrics/sample.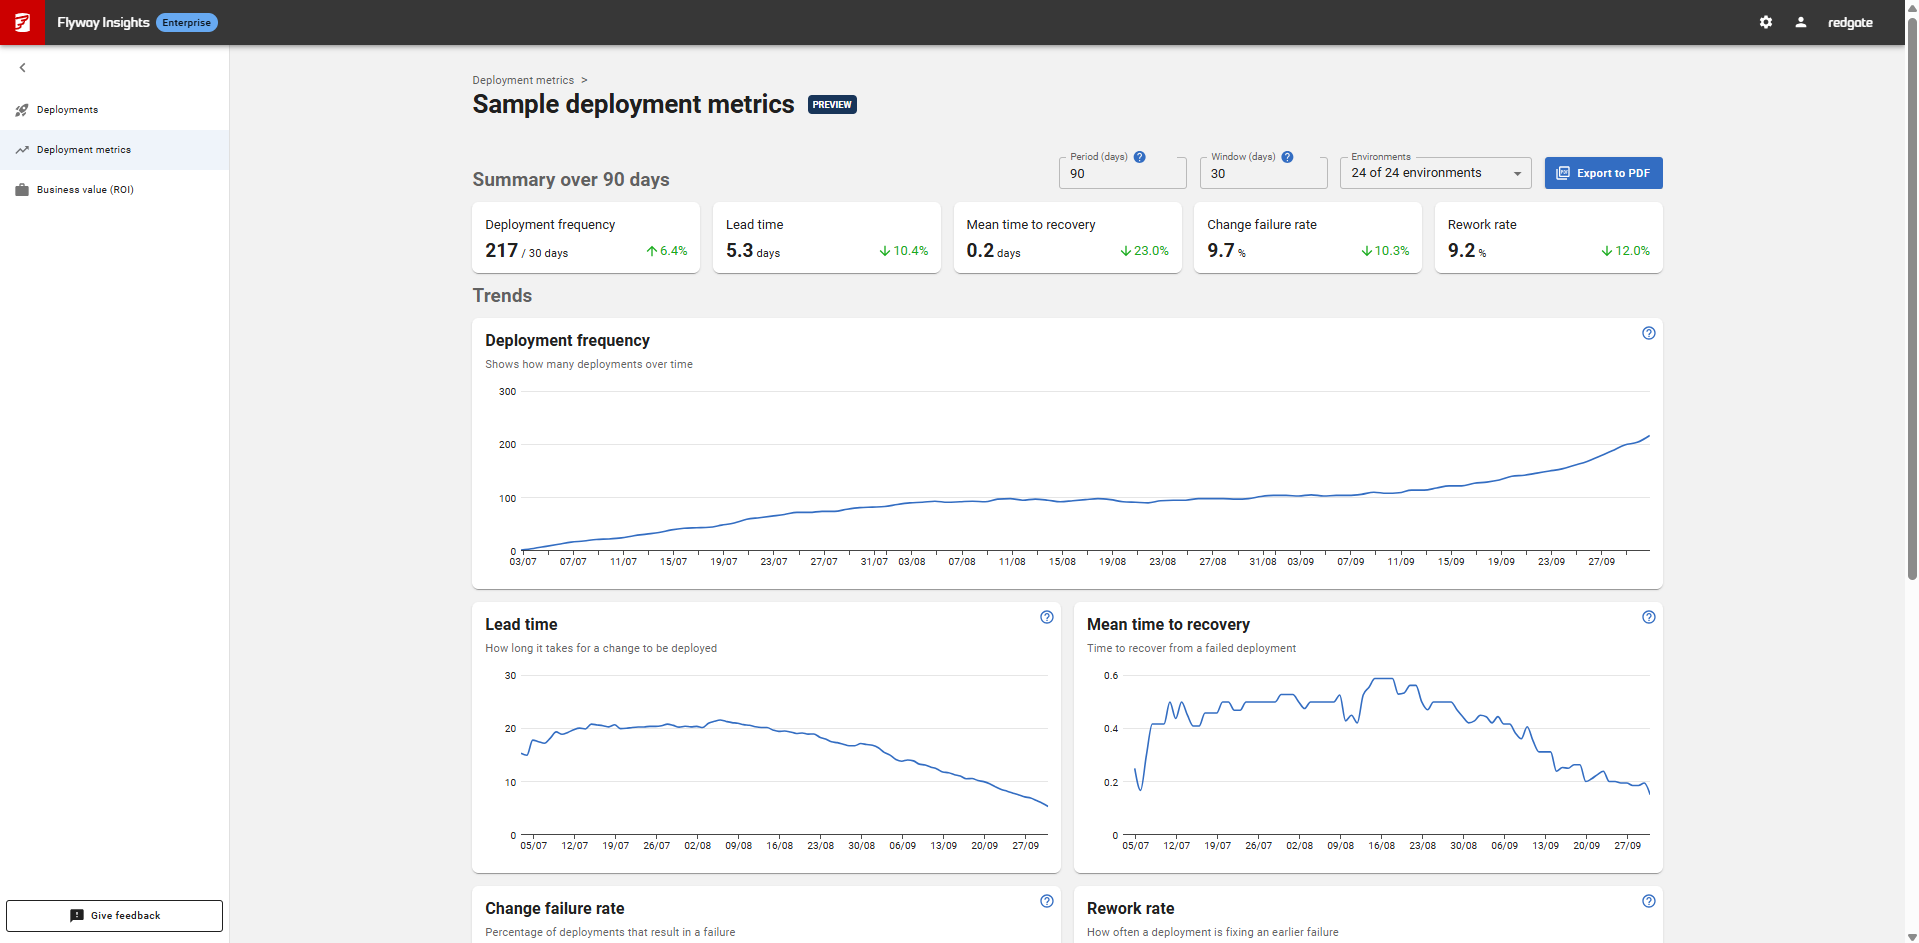
What are DORA metrics?
The DevOps Research and Assessment (DORA) program identified a small set of metrics that measure how quickly and reliably a team delivers change. Flyway Insights applies them to database changes, so you can see whether your database delivery keeps up with your application delivery.
The metrics
| Metric | What it tells you | How Flyway Insights calculates it |
|---|---|---|
| Deployment frequency | How frequently your deploying over time | The number of deployments in each window. Migrate runs that applied no migrations aren't counted |
| Lead time | How long it takes for a change to be deployed | The mean time, in days, between the timestamp in a versioned migration script's filename and its successful deployment |
| Mean time to recovery | Time to recover from a failed deployment | The mean time, in days, between a failed deployment and the next successful deployment |
| Change failure rate | Percentage of deployments that result in a failure | Failed deployments as a percentage of all deployments in each window |
| Rework rate | How often a deployment is fixing an earlier failure | Successful deployments that followed a failed deployment, as a percentage of all successful deployments |
What counts as a deployment
- Every
flyway migrateandflyway deployrun that publishes deployments counts, whether it succeeds or fails. - A migrate run that succeeds but applies no migrations is a no-op, and isn't counted.
- Dry runs aren't published, so they're never counted.
What counts as a failure
A deployment counts as a failure when Flyway reports that it failed. Drift doesn't count as a failed deployment.
A Flyway deployment may run successfully, but actually results in an issue in Production that needs to be fixed. We don't have a way to identify these failures yet. Please contact the development team, if you'd like to talk through some ideas we're thinking about in this area.
Getting lead time to work
Lead time needs to know when each change was created, so it reads a timestamp from the migration script's filename. Scripts count when their filename has a UTC timestamp in yyyyMMddHHmmss format after the version, like this:
V1_20260928143000__add_customer_table.sql
Flyway Desktop names scripts like this by default. A timestamp can be generated over the command-line using the flyway Add command. Scripts without a timestamp, and deployments from state-based projects, aren't included in lead time.
Details
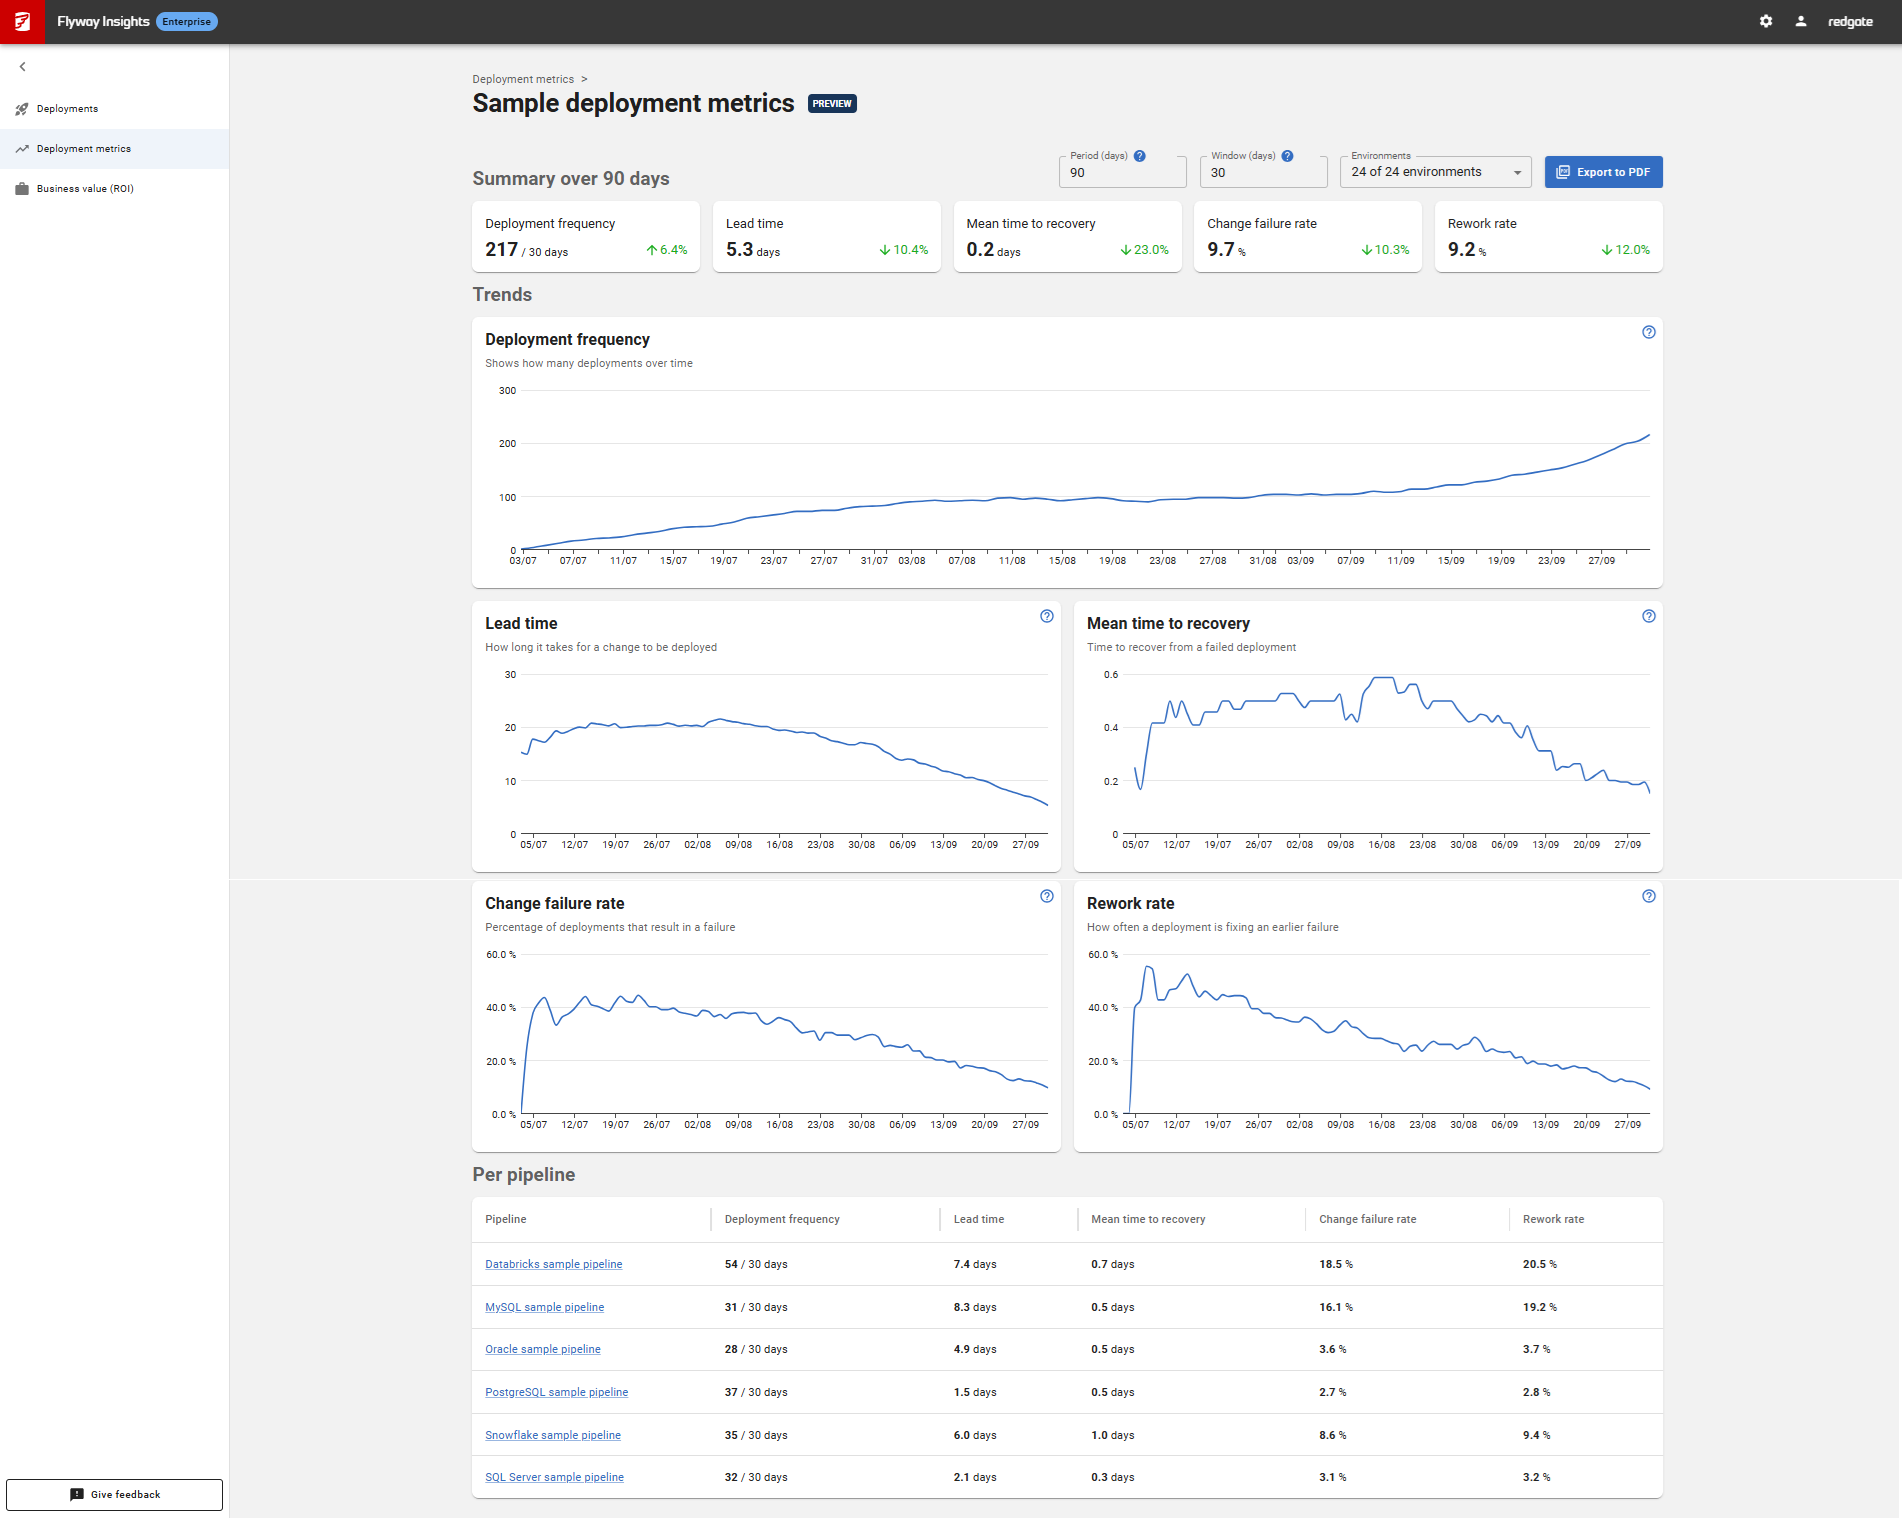
- Headline cards show the latest value of each metric, with an arrow showing whether it's moved since the previous day. This is reported across all the projects in your Redgate Organization and reflects the Environment filter at the top.
- Trends chart each metric over time. This is reported across all the projects in your Redgate Organization and reflects the Environment filter at the top.
- Per pipeline breaks the metrics down for each pipeline. Click on the row to see the Trend charts for the individual projects.
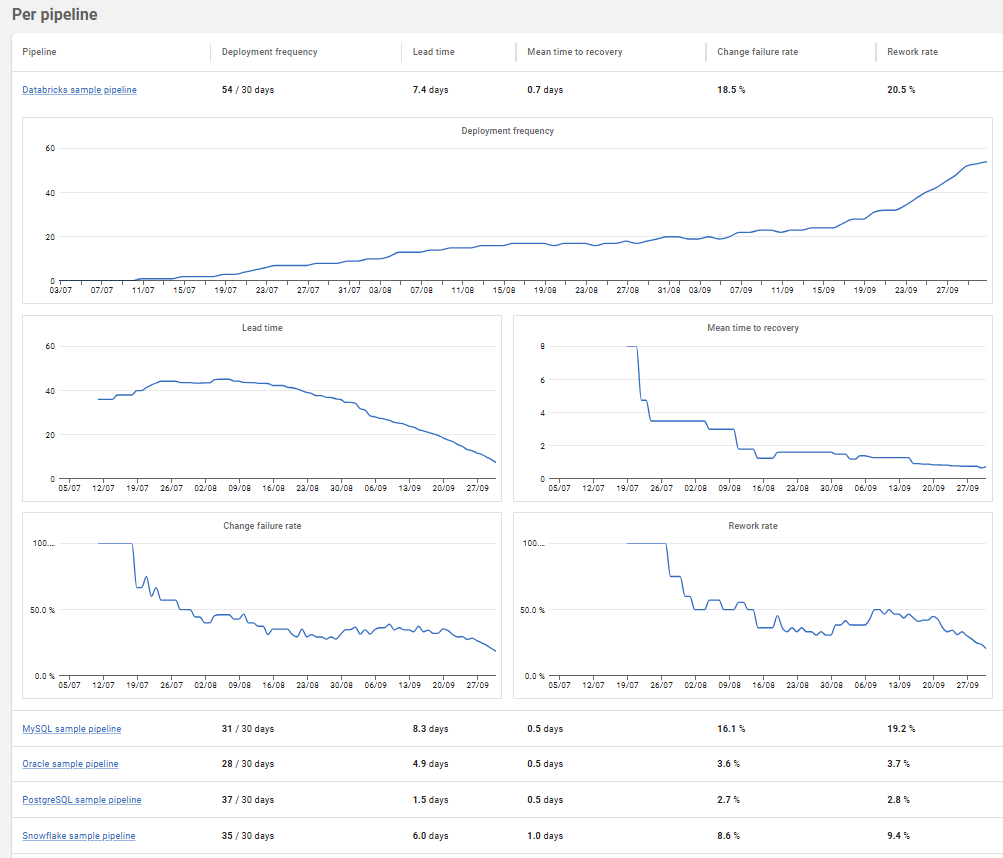
Learn more about what projects are [shared with your organization](Sharing with your organization).
Period and window
Each point on a chart is calculated over a rolling window, and the charts cover the period:
- Period (days): how far back the charts go. The default is 90 days.
- Window (days): how many days each point covers. The default is 30 days, so each point shows the previous 30 days of deployments.
Both can be set from 1 to 365 days. A longer window gives smoother trends; a shorter one reacts faster to change. These selections are shown for you. They are not shared with your organization.
Choosing environments
Use the Environments dropdown to configure which projects/environments are included in the metrics. For example, exclude development and test environments so your metrics reflect production deployments only. Your Environment selections are reflected in your Business value (ROI) page as well. These selections aren't shared with your organization.
We're currently thinking about how we can let you categorize environments to make this easier (e.g, show all Prod across all projects without selecting each one individually). Contact the development team to discuss ideas around this.
Sharing
Your period, window, and environment selections are reflected in the URL, so you can bookmark or share a view with others in your Redgate Organization.
Sharing your metrics
Select Export to PDF to download the current view as a PDF.
This documentation contains proprietary information and is protected by copyright law.
Copyright © 2026 Red Gate Software Limited. All rights reserved


