Configuring a VMWare host then adding the Virtual Machine
Published 28 March 2024
If you are monitoring SQL Server running on a VMware virtual machine, Redgate Monitor can collect a range of relevant metrics from both the guest virtual machine and the physical host to help you diagnose any problems. Redgate Monitor supports both standalone ESXi installations and also those managed by vCenter.
Getting things set up is simple: register either the vCenter or ESXi machine in the VMware hosts configuration page, and also register the SQL Server instance in the usual way in the Monitored servers configuration page. Redgate Monitor then links the SQL instance, virtual machine and physical host together for you and begins collecting data. These tasks can be performed in either order so, if you want to add VMware support to your existing hosts, you only need to go to the VMware hosts configuration page.
- To register a host go to Configuration > Estate> VMware hosts:
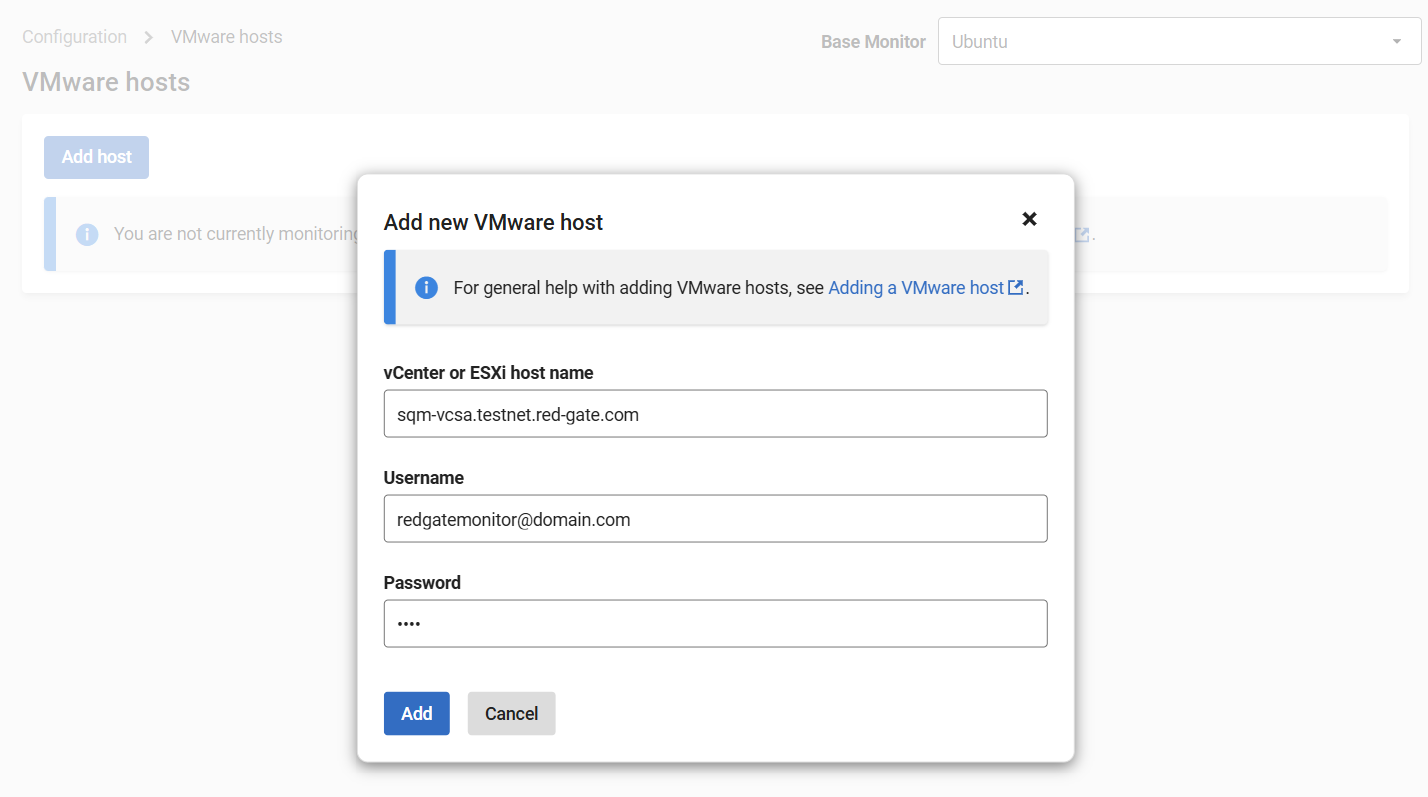
- Select the desired Base Monitor if applicable. Then click on Add Host and enter the login credentials for the vSphere endpoint. The user should have at least read-only permission across the endpoint (for vCenter, this means read-only access across the vCenter).
- When you hit Add, the virtual machines hosted on the target should be listed. Please note that VMware Tools must be installed on any virtual machine that you wish to be monitored:
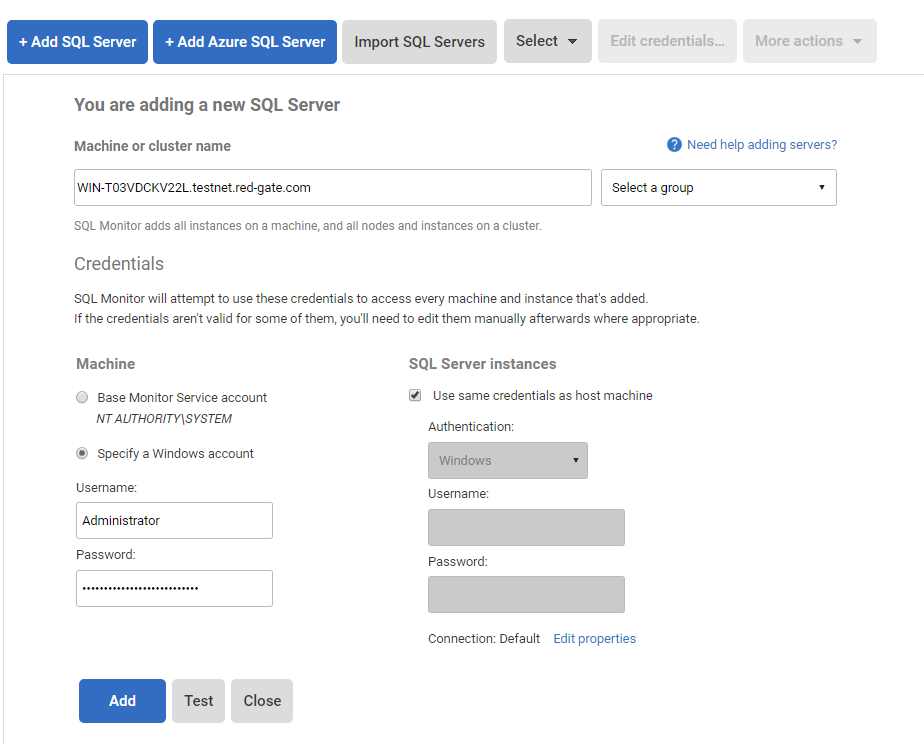
- If you've not already done so, you can now add the virtual machines as if they were normal servers:
- VMware data will be overlaid on the server/hosts section onto CPU and Memory metric graphs. Memory will show two axes, one on the left and one on the far right which applies to VMware host data:
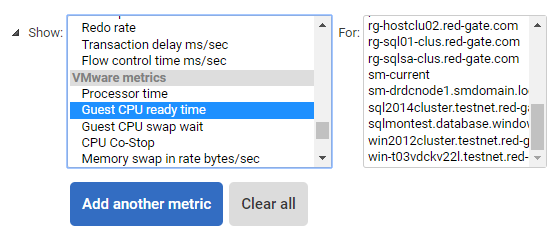
- A more detailed selection of metrics can be found in the Analysis graph page:
Unless specifically referred to as a guest metric, all metrics refer to the physical host at the sample time. We've tried to choose those that are most relevant to someone monitoring SQL Server.


