Connecting an MCP client to Redgate Monitor (MCP)
Published 10 June 2026
Availability: Self-hosted Redgate Monitor 14.28 or later only - the MCP server is not available on earlier versions or on Redgate Monitor SaaS.
When you want to answer a question about your database estate, you normally have to know which Monitor screen to open and dig through it yourself. That is fine for a deep investigation, but it can be frustrating to click through several screens and hold all the pieces together in your head just to answer one question. The Model Context Protocol (MCP) solves this by letting you connect an MCP client (an AI assistant such as Claude Code or VS Code Copilot) to your self-hosted Redgate Monitor. Once connected, the client uses a set of read-only tools to fetch answers directly from Monitor. So you can simply ask, in plain English, "find me the worst performing queries across my monitored servers" and let the client gather the answer for you.
What you can do today
Everything the MCP server exposes is read-only. See the table below for tools that the MCP client can use.
Tool name | Tool description | Version introduced |
|---|---|---|
get_base_monitors | Lists the connected base monitors in the installation. | 14.28 |
get_monitored_servers | Lists monitored servers for a base monitor, with identifiers and monitoring status. | 14.28 |
get_metrics | Returns time-series metric data (for example CPU usage) for a monitored server. | 14.28 |
get_sql_server_top_queries | Returns the top SQL Server queries by resource usage for a time range. | 14.28 |
get_sql_server_top_waits | Returns the top SQL Server wait types for a time range. | 14.28 |
get_sql_server_queries_per_wait | Returns the queries contributing to a specific SQL Server wait type for a time range. | 14.28 |
get_sql_server_estimated_query_plan | Returns the estimated execution plan for a query. | 14.28 |
get_sql_server_actual_query_plan | Returns the most recent actual (post-execution) plan captured for a query. | 14.28 |
get_alerts | Returns alerts raised within a time window, including type, status, and severity. | 14.28 |
get_alert_details | Returns the full details of a single alert. | 14.28 |
get_monitor_documentation | Points the assistant at the Redgate Monitor documentation for questions the data tools can't answer. | 14.28 |
get_sql_server_blocking_processes | Returns blocking processes within a time window | 14.30 |
get_sql_server_blocked_process | Returns information on a single blocked SQL Server process | 14.30 |
Security
The MCP server is designed to be safe to connect an MCP client to:
- Read-only. The available tools can only read data; they cannot change anything in Monitor or on your databases.
- HTTPS only. Connections are encrypted; plain HTTP is rejected.
- Dedicated, scoped token. Access uses a least-privilege MCP-role token that you scope to specific servers and can revoke at any time by deleting it.
- Rate limited. Each token is throttled to protect your Monitor installation. By default its 60 tool calls per minute. (See Configure the rate limit).
- Logged. Every request to the MCP server is logged.
Before you start
You will need:
- To be running version 14.28 or later of Redgate Monitor.
- You need to be on a Redgate Standard or Redgate Enterprise license rather than a legacy Perpetual license.
- You need the HTTPS address of your Monitor Web server (for example
https://monitor.your-company.com). MCP is only available over HTTPS. If your Monitor is not yet on HTTPS, follow Configuring HTTPS for the default Redgate Monitor web server. - Administrator access to Monitor to create an MCP access token.
- Tested with Claude Sonnet and Claude Opus. It is expected to work with equivalent models from other providers (e.g. OpenAI, Google), since MCP is an open, provider-agnostic protocol but these have not been explicitly verified by our team.
- An MCP client on your machine. Any MCP client that supports connecting to a remote MCP server over HTTPS with a bearer token should work with Redgate Monitor.
- By default, anyone running MCP Client can connect any MCP server they choose. Some organizations disable this; if yours has, ask your IT Department admin to enable MCP servers (eg: For claude code managed MCP documentation, for VS Code Copilot, see the MCP servers documentation.
Create a dedicated MCP access token
The MCP server only accepts a token created specifically for it: a token with the MCP role. Create a dedicated token for this; do not reuse an Administrator or REST API token.
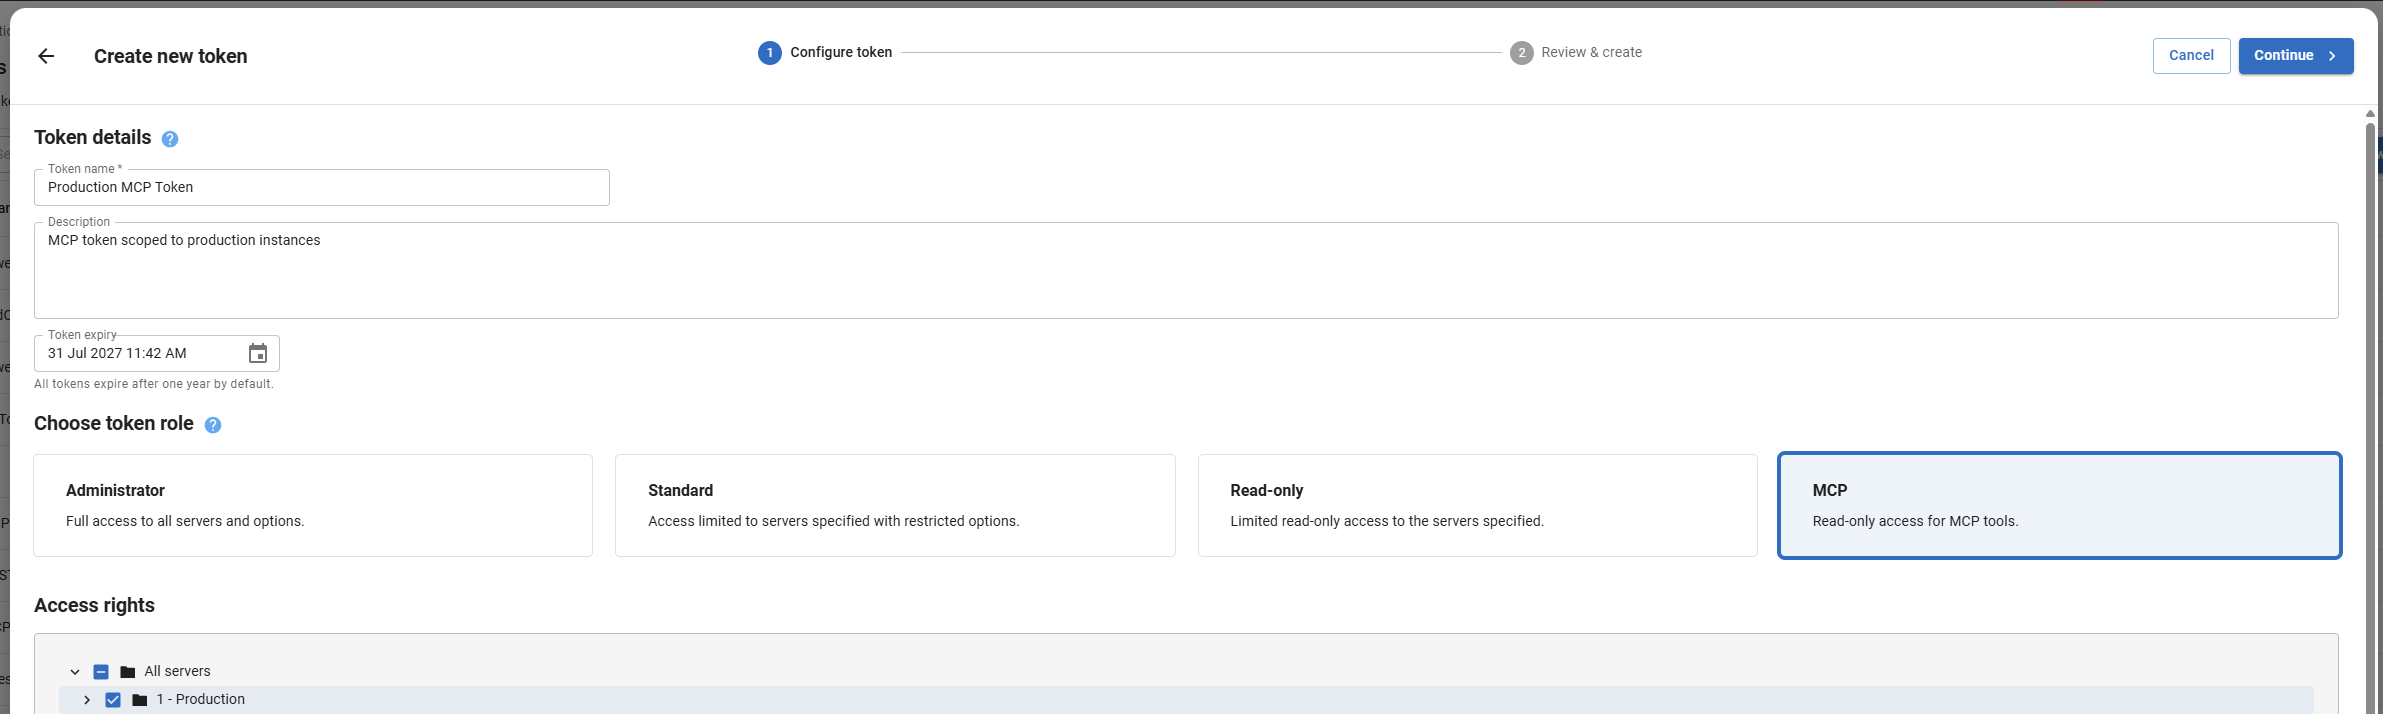
- Go to Configuration > Access tokens and choose Create new token.
- Give the token a name (and optionally a description) and set an expiry date.
- Under Choose token role, select MCP ("Read-only access for MCP tools").
- Under Access rights, choose which servers the token may see. The token can only ever read data for the servers you select here, so you can scope it as narrowly as you like.
- Select Create.
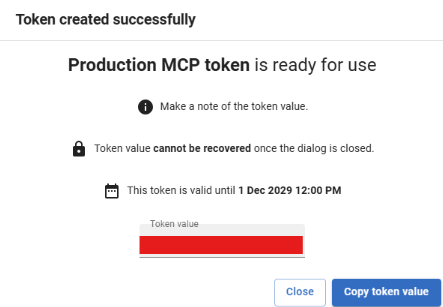
- Copy the generated token now - it is shown only once. Store it somewhere safe; you will paste it into your MCP client in the next step.
Connect your MCP client
Setup steps vary between clients, so for any client, follow its own documentation for adding a remote MCP server. You'll need your Monitor MCP address (https://<your-monitor-host>/mcp) and the MCP token you created above. The Claude Code and VS Code Copilot examples below show what this looks like in practice.
Use the Monitor address from your browser and the MCP token you just copied. We have tested the following clients:
- Claude Code CLI (Setup Instructions)
- VS Code Copilot (Setup Instructions)
- Gemini CLI (Setup Instructions)
- Cursor (Setup Instructions)
- AWS Kiro (Setup instructions)
Claude Code (CLI)
Run this in a terminal, replacing the placeholders with your Monitor address and token:
claude mcp add --transport http redgate-monitor https://<your-monitor-host>/mcp --header "Authorization: Bearer <your-mcp-token>"
You should see a confirmation such as "Added HTTP MCP server redgate-monitor".
VS Code Copilot
- Paste the following instructions to co-pilot AI and provide it the Monitor host url. It will configure it for you, and once configured press Start and input the token when prompted. Otherwise follow the steps manually.
Press
Ctrl + Shift + P, type MCP: Open User Configuration, and open themcp.jsonfile.Add the Redgate Monitor server. If the file already has content, place the entry inside the existing
serverssection and add the input to theinputsarray:{ "servers": { "redgate-monitor": { "type": "http", "url": "https://<your-monitor-host>/mcp", "headers": { "Authorization": "Bearer ${input:redgate-mcp-token}" } } }, "inputs": [ { "id": "redgate-mcp-token", "type": "promptString", "description": "Redgate Monitor MCP token", "password": true } ] }Save the file (
Ctrl + S).Press
Ctrl + Shift + P, type MCP: List Servers, select redgate-monitor, and choose Start. When prompted, paste your MCP token and pressEnter.
Verify the connection
- Claude Code: start Claude Code (
claude), then type/mcp. Theredgate-monitorserver should appear with a connected status. 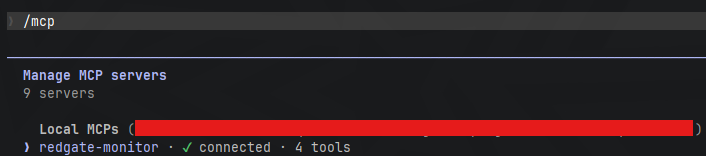
- VS Code Copilot: the
redgate-monitorserver should show as running. 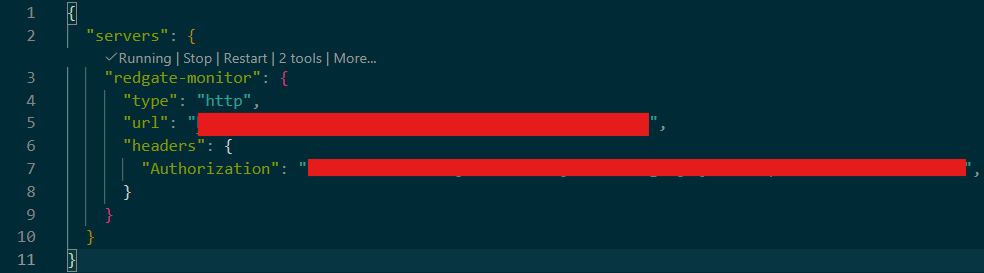
- Then try asking your MCP client:
"What servers are being monitored?"
If you get a list of your monitored servers back, the connection is working.
Troubleshooting
| What you see | What to do |
|---|---|
Unauthorized / 401 / 403 | Check the token is correct, not expired, and was created with the MCP role. Tokens with other roles are rejected by the MCP endpoint. |
Connection refused / cannot reach the server | Check the Monitor address is correct and reachable from your machine, and that you used https://. |
| SDK error, unable to get local issuer certificate when connecting | This is a Claude code level error. Ask IT team to allowlist *.anthropic.com on the TLS-inspecting proxy, or set NODE_EXTRA_CA_CERTS to the corporate CA bundle (Anthropic network configuration documentation) |
| Certificate / TLS trust error | The Monitor website's certificate must be trusted by your machine. Use a certificate trusted by your organization. |
Server shows as failed in /mcp | Remove the server (claude mcp remove redgate-monitor in Claude Code) and re-add it with a fresh token. |
| The MCP role isn't offered when creating a token | Make sure the MCP server is turned on (see Turn on the MCP server) and that you restarted the Redgate Monitor Web Service, then reopen the Create-token wizard. |
| On Claude Code: "unable to get local issuer certificate" | See troubleshooting steps by Anthropic. |
Example prompts to get started
- To know the current status of the estate:Summarise the current state of my monitored estate. Retrieve all monitored servers and group them to show how many instances of each type I have (SQL Server, PostgreSQL, etc.), how they're distributed across server groups, and how many are currently healthy versus not actively monitored or in a non-running state. Before summarising, ask whether I want to narrow the overview to a specific server group, and wait for my response before continuing - if I don't specify one, cover the full estate. Present a concise breakdown with counts, and flag anything that isn't being monitored normally - but do not suggest investigating or drilling into it. This is an overview only: do not query metrics or individual queries, and do not propose any follow-up actions, next steps, or offers to drill into specific instances. End with the summary only.
- To find out the problematic queries across the estate:Show the most resource-intensive SQL Server queries over the last 2 hours. First list my monitored SQL Server instances and ask which to check — up to 25, or blank for all (if more than 25, use the first 25 and say so). In the same question, ask whether I want to narrow the selection by server group and whether to filter or sort the results by a specific database, and wait for my response before continuing. For each chosen instance, retrieve its top queries ranked by impact over the last 2 hours and summarise the worst offenders - include the query text and what makes each expensive (duration, CPU, reads). Treat each instance independently: do not compare or rank queries across different instances.
- To understand resource usage across the estate: Check CPU and memory health for my SQL Server instances over the last 2 hours. First list my monitored SQL Server instances and ask which to check — up to 25, or blank for all (if more than 25, use the first 25 and say so). In the same question, ask whether I want to narrow the selection by server group, and wait for my response before continuing. For each chosen instance, retrieve SqlServerCpuPercentage for the instance, MachineCPUPercentage and MachineMemoryUsed for its host machine, all over the last 2 hours. Analyse the data across the time range to calculate a baseline for each metric, then use that baseline to identify any spikes, sustained pressure, or trends. Always tell me the calculated baseline values, then summarise whether instance CPU, host CPU, and host memory look elevated, sustained, or trending and flag anything under pressure.
Configure the rate limit (optional)
To protect your Monitor installation, each MCP token is rate limited. By default it allows 60 requests every 60 seconds per token, which is plenty for normal use, so most people can skip this section.
If you want to change it, add an Mcp section to the same appsettings.json file you edited in Turn on the MCP server (C:\ProgramData\Red Gate\Redgate Monitor\appsettings.json):
{
  "Mcp": {
    "RateLimiter": {
      "Enabled": true,
      "RequestsPerInterval": 60,
      "IntervalSeconds": 60
    }
  }
}Enabled- set tofalseto turn the rate limit off entirely (not recommended).RequestsPerInterval- how many requests each token may make in one interval.IntervalSeconds- how long that interval lasts, in seconds.
For example, to allow 120 requests per minute, set RequestsPerInterval to 120 and leave IntervalSeconds at 60. As with turning the server on, restart the Redgate Monitor Web Service after saving for the change to take effect.
This documentation contains proprietary information and is protected by copyright law.
Copyright © 2026 Red Gate Software Limited. All rights reserved


