Connecting to Power BI
Published 07 September 2026
What this page covers: connecting Power BI Desktop to the Redgate Monitor v2 API with the built-in Web connector, and building a report with a monitored servers table, a metrics catalogue table, and a time series chart of metric data.
Steps 1 and 2 use only the Power BI user interface. Step 3 needs a short query that you copy and edit.
What you need:
- Power BI Desktop on Windows
- A Redgate Monitor instance with the v2 API enabled (self-hosted with an Enterprise licence)
- A read-only API token from that instance. See Authentication.
- Network access to your Redgate Monitor URL
In the steps below, replace https://your-monitor-instance.example.com with your own Redgate Monitor URL, and PASTE_READONLY_TOKEN with your own token.
Step 1 - add the monitored servers table
This table lists the servers that Redgate Monitor monitors. You need it to find the entityId values for Step 3.
- Click Home, then Get data, then Web.
- Select Advanced.
- Set the URL parts field to
https://your-monitor-instance.example.com/api/v2/monitored-servers. - Under HTTP request header parameters, set the first field to
Authorizationby typing into the box. It is not in the dropdown. Set the second field toBearer PASTE_READONLY_TOKEN, replacingPASTE_READONLY_TOKENwith your own token. - Click OK.
- When Power BI asks for credentials, select Anonymous, then click Connect. The token is in the header you added in step 4, so no other credentials are needed.
- Click Load.
Power BI reads the response envelope and gives you a table of servers.
If you see an error, check that:
- The token is correct and has not expired.
- Your network can reach the Monitor URL.
- The v2 API is enabled on your Monitor instance (requires an Enterprise licence).
To see the table on the report page, click the Table visualisation, then select the fields you want.
Step 2 - add the metrics catalogue table
This table lists the metrics that Redgate Monitor collects. You need it to find the metricId values for Step 3.
Repeat Step 1, but set the URL parts field to:
https://your-monitor-instance.example.com/api/v2/metrics
Step 3 - get the metric data
The metric data endpoint takes one metricIds parameter for each metric, and one entityIds parameter for each server. The Power BI user interface cannot build repeated parameters, so this step uses a query that you edit by hand.
- Click Home, then Get data, then Blank query.
- In the Power Query Editor, click Advanced Editor.
- Replace the contents with the query below.
- Edit
BaseUrl,Token,MetricIds,EntityIds,StartTimeandEndTime. Copy theidvalues from the metrics catalogue table, and theentityIdvalues from the monitored servers table. Add one line for each value. - Click Done, then Close & Apply.
let
    BaseUrl  = "https://<monitor>",
    Token    = "PASTE_READONLY_TOKEN",
    // Copy metric Ids from the Metrics Catalogue table; each becomes a line.
    MetricIds = { "SqlInstance.SqlStatistics.BatchRequestsPerSecond" },
    // Copy entityId values from the Monitored Servers table; each becomes a line.
    EntityIds = { "r1,4:base,s36:...,17:SqlServerInstance,1,4:Name,s14:...," },
    StartTime = "2026-08-26T00:00:00Z",
    EndTime   = "2026-08-27T00:00:00Z",

    MetricQuery = Text.Combine(List.Transform(MetricIds, each "metricIds=" & Uri.EscapeDataString(_)), "&"),
    EntQuery = Text.Combine(List.Transform(EntityIds, each "entityIds=" & Uri.EscapeDataString(_)), "&"),
    Path = "api/v2/metrics/data?" & MetricQuery
         & "&" & EntQuery
         & "&startTime=" & Uri.EscapeDataString(StartTime) & "&endTime=" & Uri.EscapeDataString(EndTime),
    Response = Web.Contents(BaseUrl, [
                   RelativePath = Path,
                   Headers      = [Authorization = "Bearer " & Token],
                   Timeout      = #duration(0, 0, 5, 0)   // default is only 100s
               ]),
    Data     = Json.Document(Response)[data],
    ToTable  = Table.FromList(Data, Splitter.SplitByNothing(), {"Series"}),
    Expanded = Table.ExpandRecordColumn(ToTable, "Series",
                   {"metricId","metricName","entityType","entityName","dataUnit","dataPoints"}),
    Points   = Table.ExpandListColumn(Expanded, "dataPoints"),
    Fields   = Table.ExpandRecordColumn(Points, "dataPoints", {"timestamp","value"}),
    Typed    = Table.TransformColumnTypes(Fields,
                   {{"timestamp", type datetimezone}, {"value", type number}})
in
    Typed
Notes on the query:
- Every metric you list must be valid for every server you list. If one is not, the API returns a 422 error.
- The time range must be at least 15 minutes. The v2 API returns an error for shorter ranges.
- The query sets a 5 minute timeout, because the Power BI default of 100 seconds is often too short.
- The query passes the base URL as the first argument to
Web.Contents, and the rest of the URL asRelativePath. This lets Power BI refresh the query.
Step 4 - add the chart
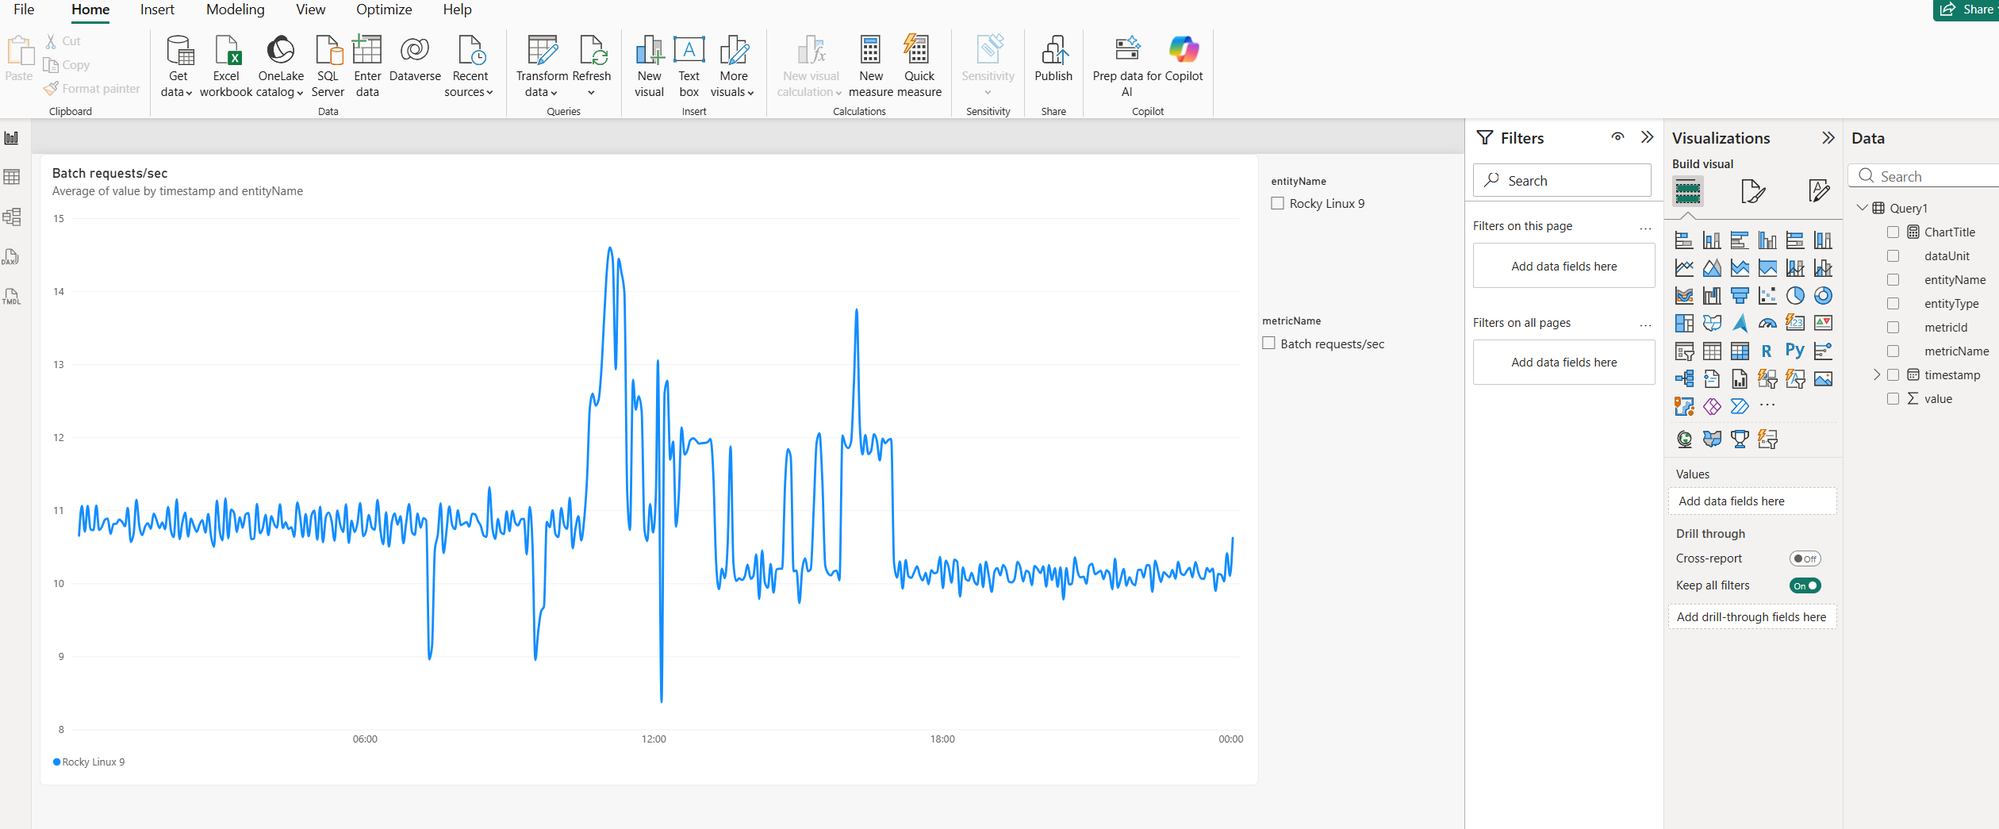
- Click the Line chart visualisation.
- Set X-axis to
timestamp. Click the arrow next to the field and selecttimestamprather than Date Hierarchy. - Set Y-axis to
value. Click the arrow next to the field and select Don't summarize. - Set Legend to
entityName.
To filter the chart, click the Slicer visualisation and set its field to entityName. Add a second slicer for metricName.
How it works together
Steps 1 and 2 give you the ids you need. Step 3 uses those ids to fetch the metric data, and shapes the response into one row for each data point. Step 4 draws one line for each server. To change the metrics, the servers or the time range, edit the values at the top of the query in Step 3 and refresh.
Want to see other examples?
If you're connecting a different tool to the v2 API, or want to see another worked example like this one, get in touch.
This documentation contains proprietary information and is protected by copyright law.
Copyright © 2026 Red Gate Software Limited. All rights reserved


