User processes, Error log and databases
Published 28 March 2024
These sections can be found at the bottom of the Postgres Instance page.
Data within them is bounded by the time range selected in the focus window of the interactive activity graph at the top of the page.
User Processes (Top 10 by query duration)
Shows information about the most active PostgreSQL query processes as provided by the pg_stat_activity view.
Combined information of a client connected to a server process.
Rows with a leading chevron can be expanded to show the SQL text for the latest query to be run by this server process.
Process
Process ID (pid) of this server process
Login time
Time at which the client connected to the server process
Username
Name of the user logged in to the backend by this server process
Address, Port
IP address or Hostname from which the client is connecting to the server process
Program
Name of the application connecting to this server process
Status, Status change
The latest state of the server process, within the selected focus window, and the time at which it last changed
Query duration
Duration of the latest query this server process has executed
Connection duration
Length of time the client connection to the server process has been active
Error Log
Shows events from the PostgreSQL error log selected from within the focus window.
Results per page can be selected, and pages can be navigated through with the pagination tool on the right.

The Log Time, Process Id, Severity and Message from the event in the PostrgeSQL log are shown
Databases
Shows more detailed information about each database hosted by this instance.
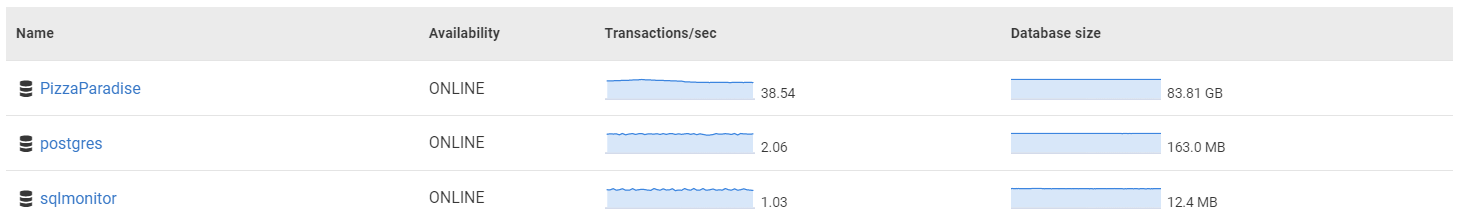
In default state, with no database selected
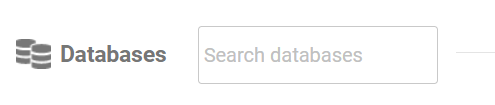
Databases are listed in a table which is paginated and can be navigated with a similar control to the the Error Log section (above). There is also a search box to filter by Name.
Individual databases can be selected by clicking their name.
The table shows the database Availability (whether or not it is online and available for Redgate Monitor to interrogate). Table also shows sparkline graphs for Transactions/sec and Size.
With database selected
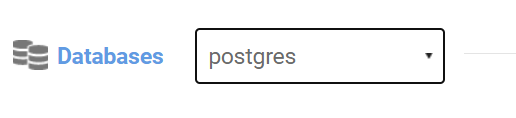
To return to the default state, with no database selected, the section heading "Databases" can be clicked.
Sparkline graphs are shown for these values, for the selected database. These are scoped to the focus window. See Host Machine Metrics page for details of these values.
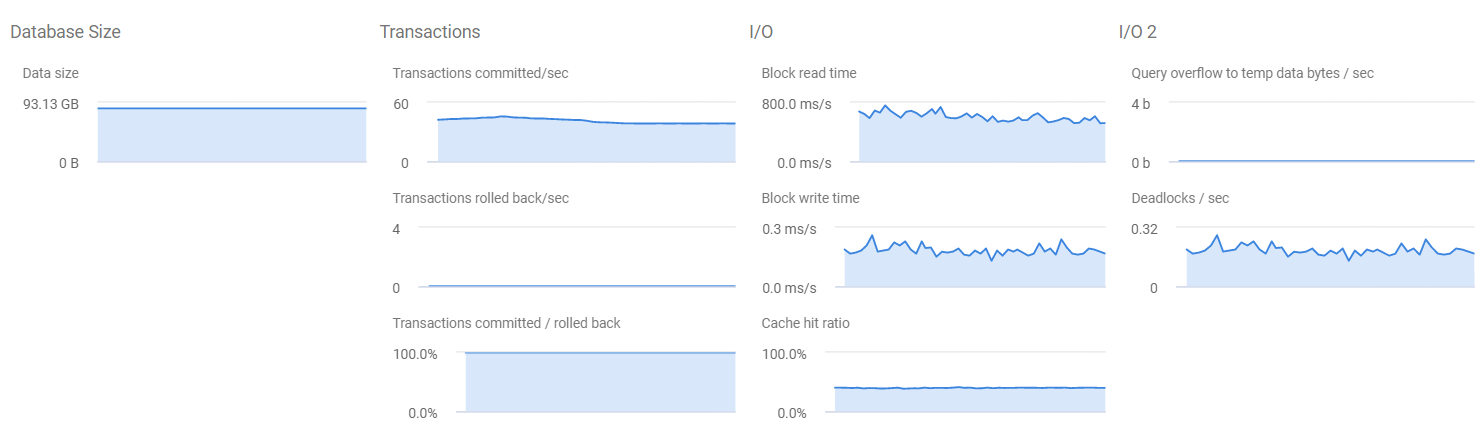
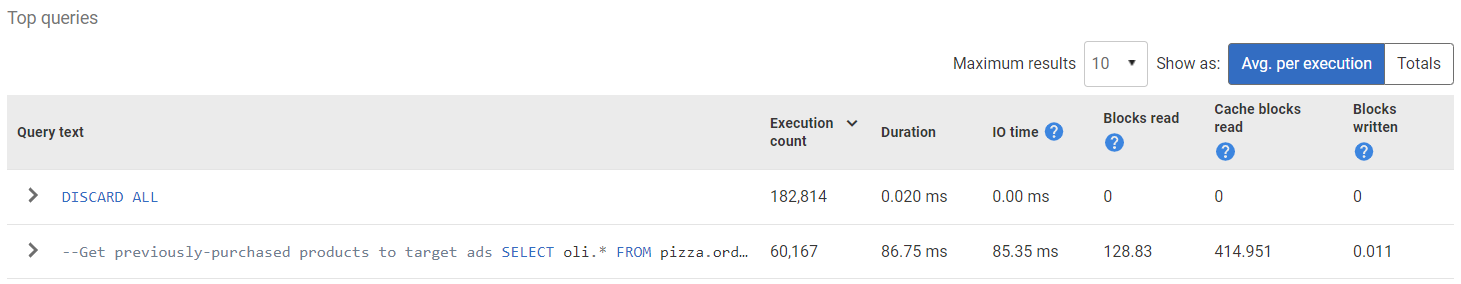
Top Queries are also shown for the selected database.
This documentation contains proprietary information and is protected by copyright law.
Copyright © 2026 Red Gate Software Limited. All rights reserved


