This worked example is for ANTS Memory Profiler 7.

In this worked example, ANTS Memory Profiler is used to find out what uses most memory in Red Gate's Exception Hunter:

  1. The Byte[] class is the largest class, accounting for 73.74MB of managed memory used by the application.
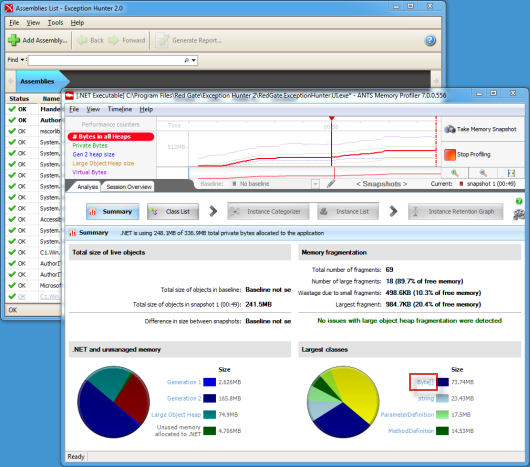
  2. Click Byte[].
  3. The Instance Categorizer shows that most instances of Byte[] (totaling 23.9MB) are held on a path where the shortest route to a GC root object leads to an object called cB. On the Byte[] node on this path, click Show instances on this path.
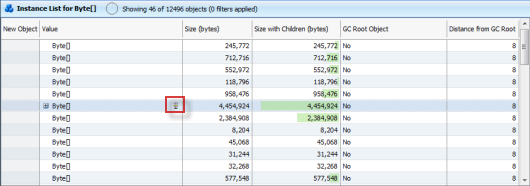
  4. The Instance List lists the 46 objects on this path. For instances of System.String it might be interesting to use the Instance List to look at the values of the strings, but this is unlikely to be the case for Byte[] instances, so choose any one and click .
    (All of the instances in the Instance List are all on the same shortest path, so it should make little difference which one you choose. Selecting the instance with the greatest size with children is often a sensible start, however.)
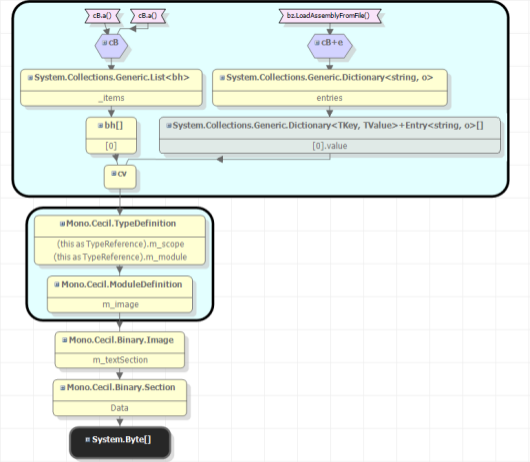
  5. The Instance Retention Graph shows which other types keep this instance in memory.

Conclusions:

  1. The Byte[] class accounts for most memory used by this program (73.74MB).
  2. The largest number of objects from the Byte[] class (46 instances, totaling 23.9MB) are held on a path leading back to a GC root object from the class cB.
  3. The selected instance is being kept in memory by cv, which in turn is being kept in memory by both cB and cB+e.
  4. You now need to decide whether this should be the case, or whether there is a problem.