Alerts
Published 04 October 2023
Contents
Prometheus is an open-source software system with many components. It's mainly used for collecting metrics, but also comes with optional alerting.
Redgate Clone ships with Prometheus and is configured with the Alertmanager turned on. There are several pre-defined alerts to help identify problems with the kubernetes cluster. The alerts are based on prometheus metrics.
N.B. An alert called Watchdog in the general rules group should always be firing. It's meant to prove that the alerts are working.
Accessing the alerts
Access the alerts from Grafana. At the top left of Grafana, in the menu, choose Alerting.
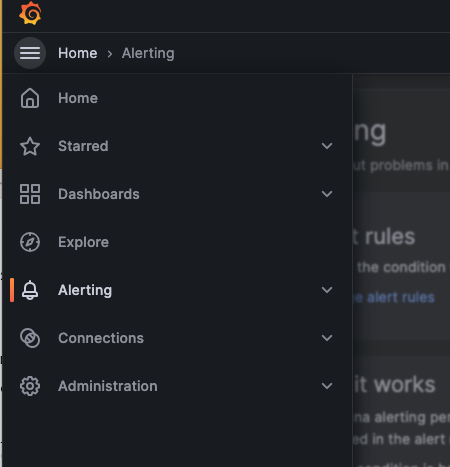
Then choose, Alert rules.
Understanding the alerts
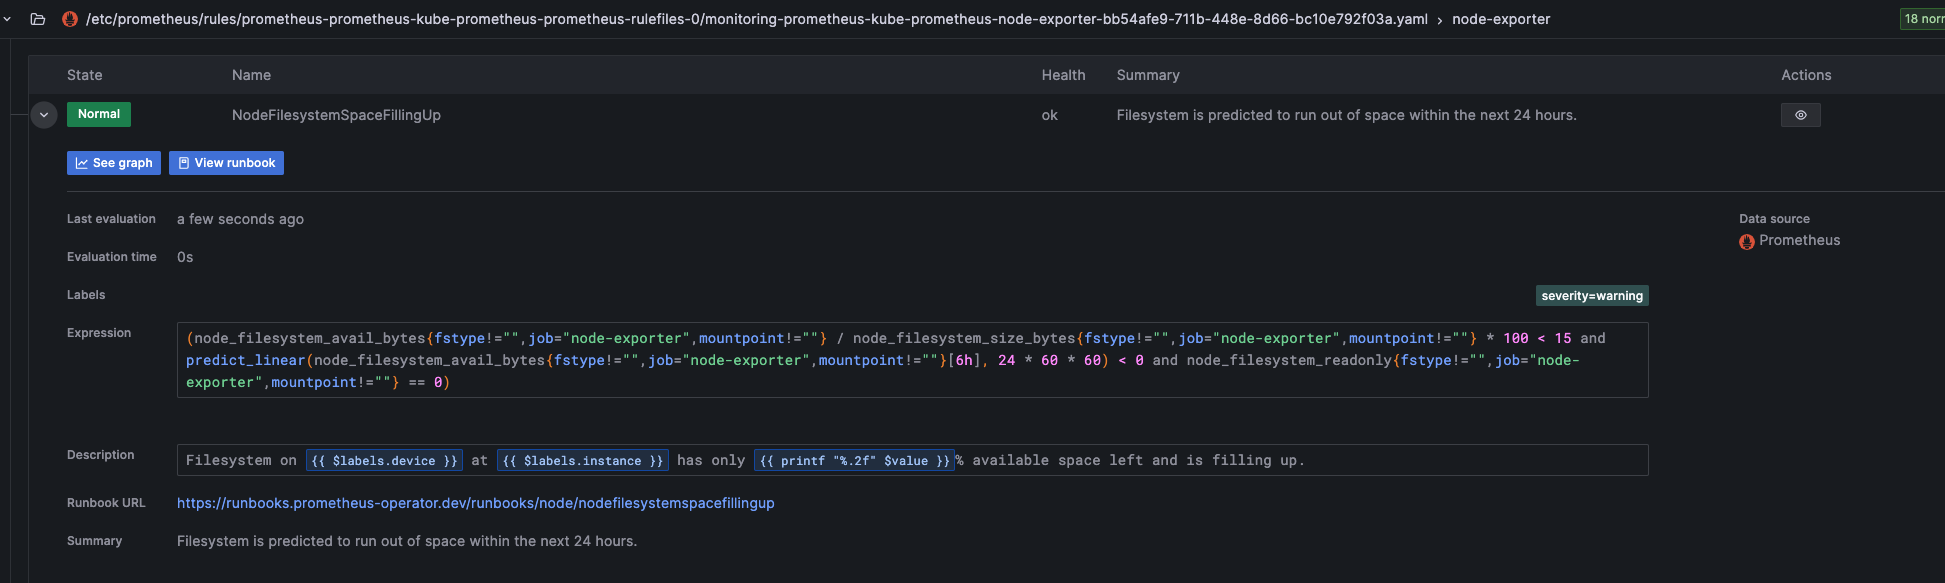
Rules are sorted into two major groups. At the top are Grafana managed alerts, Below are alerts from kube-prometheus. Grafana managed alerts include custom Redgate Clone alerts.
Each group can be expanded for more information on what the rule verifies and the prometheus metrics involved.
You can add you're own alerts from the grafana console, just be aware they aren't persisted. If you re-install the cluster, it gets lost.
Grafana managed alerts can be attached to notification policies.
This documentation contains proprietary information and is protected by copyright law.
Copyright © 2026 Red Gate Software Limited. All rights reserved


