Grafana: Logs
Published 10 August 2023
Browse logs in the Grafana Explore section.
Contents
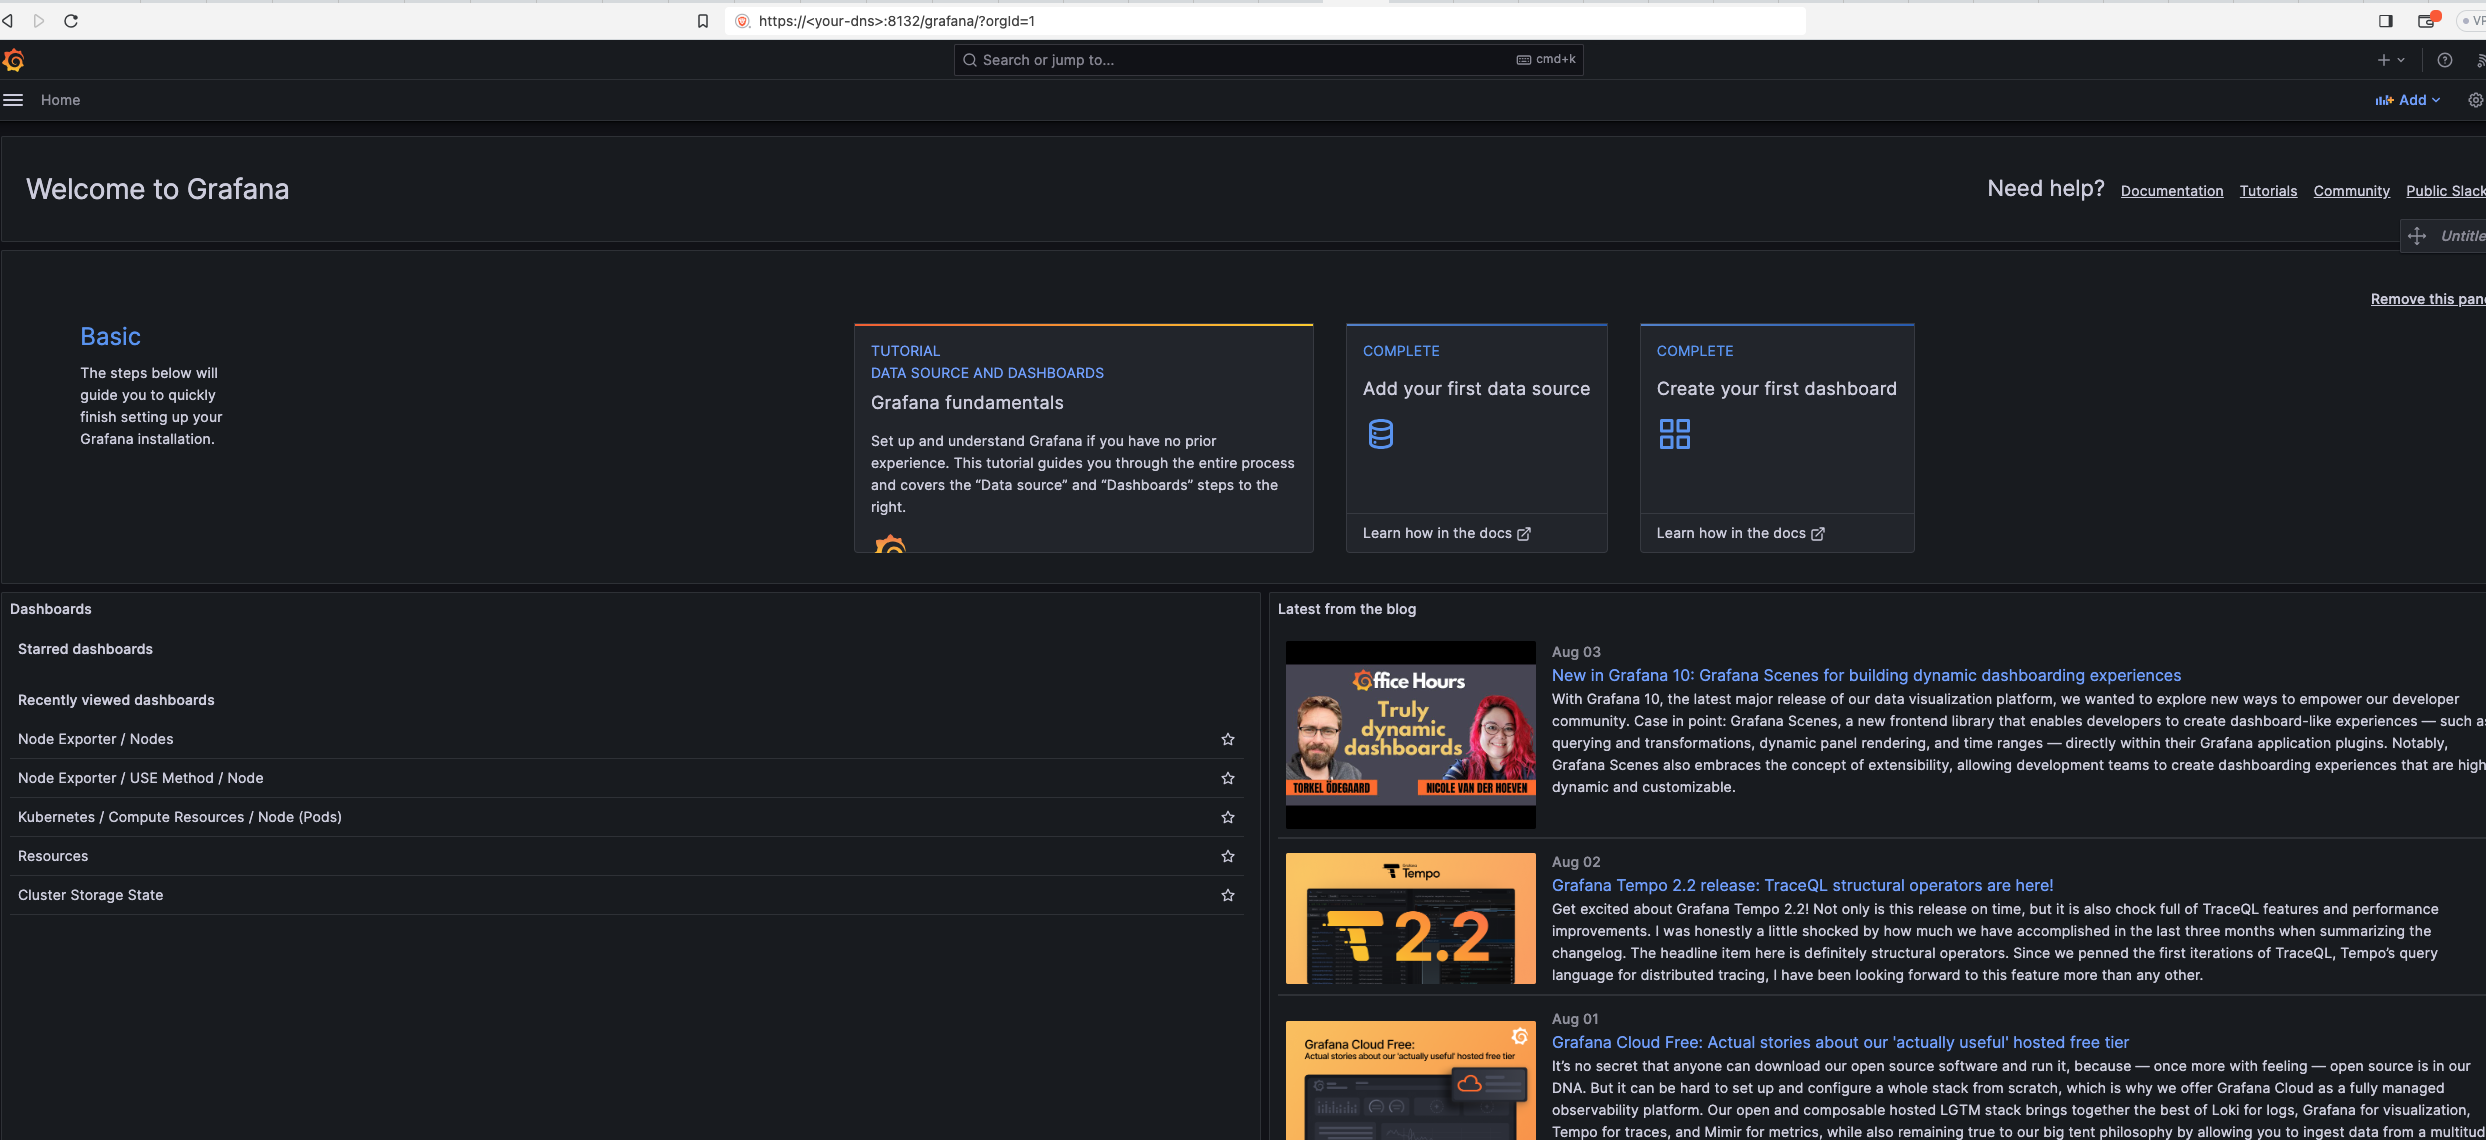
Access Grafana Window
Embedded clusters https://<web-api-endpoint>:8132/grafana
AKS clusters https://<web-api-endpoint>/grafana
(<web-api-endpoint> is the DNS address of the host machine.
Explore logs
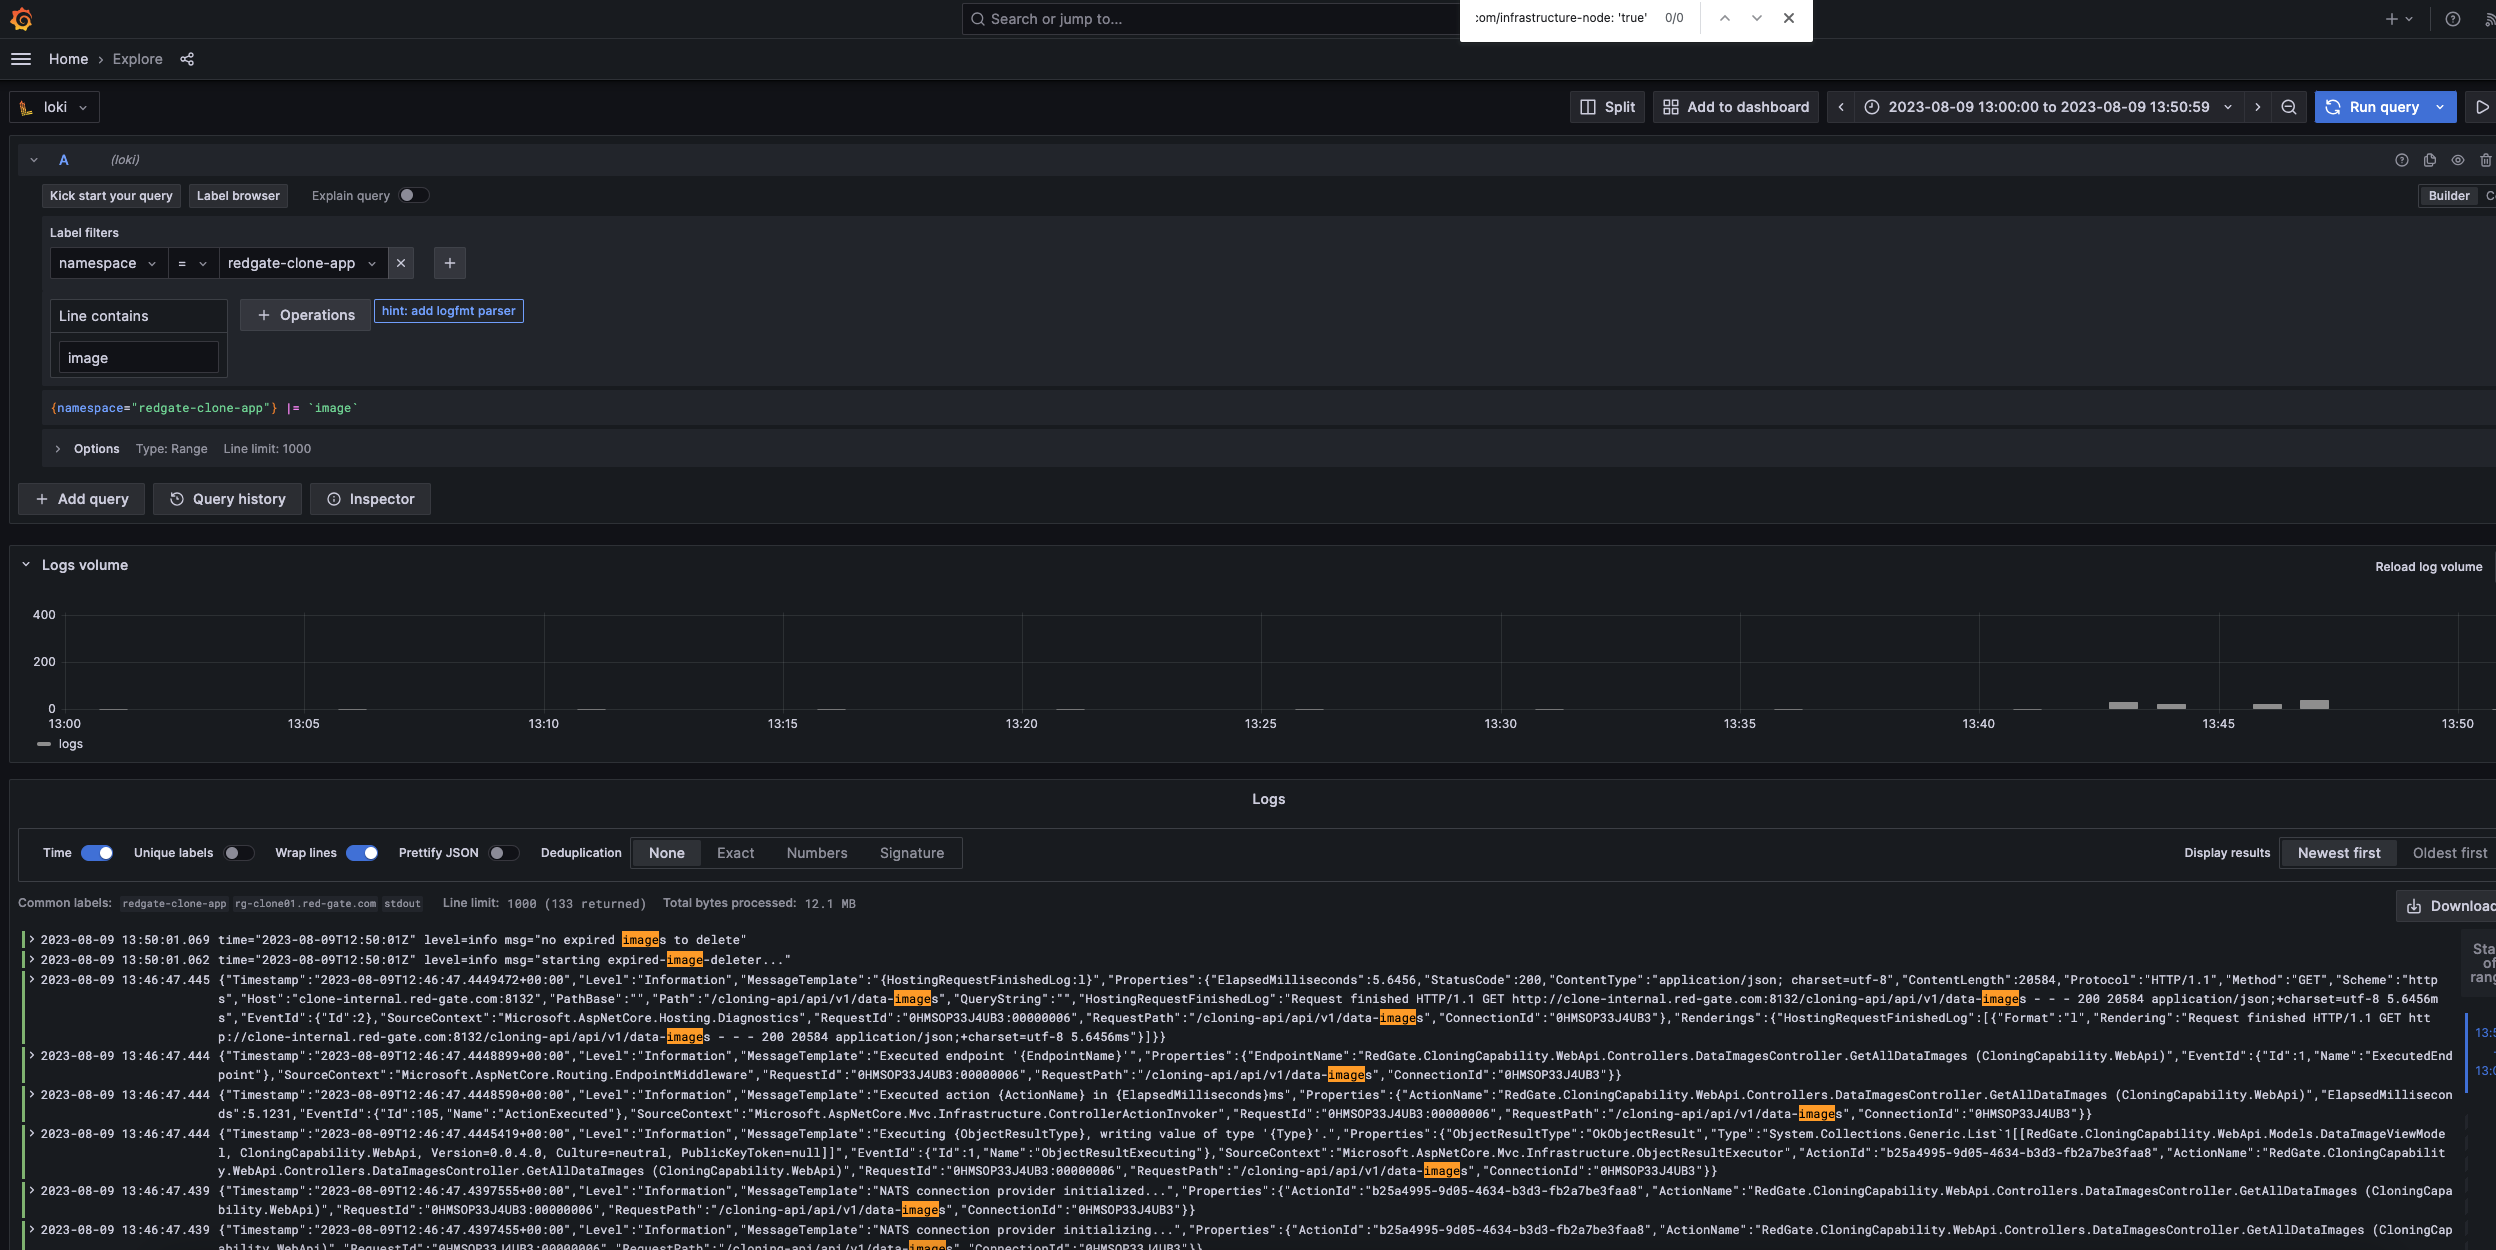
In the left hand menu, select Explore and choose the Loki datasource at the top of the page.
From here you can enter queries with "Label filters". Understanding the labels requires some knowledge of kubernetes.
The Redgate clone logs will be found in 2 different kubernetes namespaces: redgate-clone-app and redgate-clone-data.
Querying a time interval with those labels will show you everything.
To filter within those namespaces you can then apply another filter, like for instance a pod name.
To filter even further add some text in the "Line Contains"
You also have the option to apply operations like a sum.


