Working with assemblies
Published 10 July 2013
This page describes how to load .NET assemblies into .NET Reflector for decompilation, how to regenerate assemblies, and how to explore the assemblies that have been decompiled. It also explains how to use breakpoints.
Decompiling assemblies
.NET Reflector decompiles the assemblies and then stores them for future use.
To decompile an assembly:
Open your project in Visual Studio.
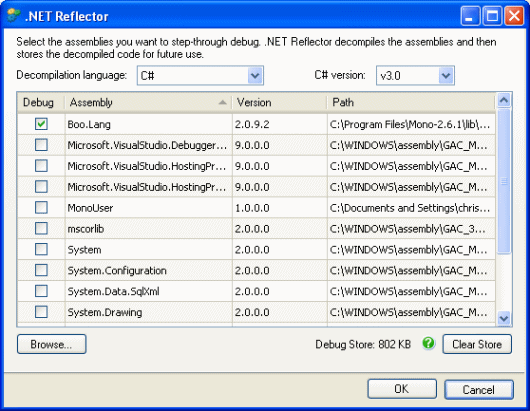
- On the .NET Reflector menu, click Choose Assemblies to Debug.The Debug and Decompile dialog box is displayed.
Your project is scanned and all the assemblies that are referenced by your project are displayed alphabetically. This also includes all the assemblies that they reference, and so on. - Select the assemblies to decompile and the decompilation language. If an assembly is not shown in the list, click Browse and select the assembly.
- Click OK to decompile the assemblies.
This may take a few minutes, depending on the assemblies selected. The decompilation status for each assembly is shown.
Once you have decompiled an assembly, you can debug the decompiled code as if it were your own, and navigate directly into the decompiled code.
Decompilation language
The decompilation language is the language that the code is decompiled into. This is automatically selected to match the language and version of the startup project. Selecting an alternative language may cause your code to be displayed in a different way to what you expect. The language version refers to the coding language and should not be confused with the .NET version.
Why is a PDB file produced?
During decompilation of the assembly, a PDB file is produced. The PDB file is a mapping file that maps back to the source code and contains debugging information.
Regenerating assemblies
Some assemblies require a debugger signature to be added before they can be decompiled. The debugger signature is used by Visual Studio to identify which PDB file is associated with a particular assembly.
If the decompiled assemblies require a debugger signature, then regenerated copies of the assemblies need to be created containing the signature.
To regenerate an assembly:
- Follow the procedure for Decompiling assemblies.
If the decompiled assemblies require a debugger signature to be added then a dialog box is displayed. - Click Browse in the dialog box to specify where you are going to save the copies of the assemblies.
You must not save the regenerated copies in the same location as the original assemblies. - Click Regenerate.
The assemblies are regenerated with the debugger signature added.
After the regeneration has completed, you are asked whether you want your solution to reference the regenerated copies of your assemblies; this is called reference switching, and is only offered immediately after regeneration. - Click Yes.
The assemblies can now be decompiled as normal.
Occasionally, your solution cannot be pointed to the regenerated copies. An information message is displayed providing further information.
Using the original assemblies
Reference switching is used to point your solution at regenerated copies of assemblies. The presence of debugger signatures allows the assemblies to be decompiled as normal. However, you may want to revert back to the original versions of the assemblies before regeneration. To do this, on the .NET Reflector menu, click Undo Reference Switch. Once clicked, Undo Reference Switch is disabled.
If you have reverted back to an original assembly, you can no longer debug that assembly without decompiling again.
Exploring decompiled assemblies
You can use Visual Studio's Object Browser to explore the decompiled assemblies. You can treat the decompiled assemblies in the Object Browser just like live code.
To navigate around the code, use the Go To Decompiled Definition menu option. This takes you into the decompiled source code, enabling you to set break points to help you in debugging the code.
To explore an assembly:
On the .NET Reflector menu, click Explore Decompiled Assemblies.
You are taken to Visual Studio's Object Browser, where you can navigate into the decompiled assemblies just like any other source code. The Object Browser only shows public methods. To show private methods, open the class and navigate to the definition.


