Debugging into SharePoint and seeing the locals
Published 16 November 2015
The debugging functionality in .NET Reflector is based in Visual Studio. It lets you use the Visual Studio debugger with decompiled code, so you can step through it, set breakpoints, and so on. However, for debugging scenarios like working with SharePoint, the assemblies are hosted and loaded outside Visual Studio. Reflector generates PDB files and allows you to step through the code, but the optimizations made by the CLR mean that you cannot see the values of the local variables.
This limits debugging because you cannot watch these values as they change, and properly follow the data flow. In this article, our technical lead Clive discusses a method for enabling locals for debugging sessions attached to the SharePoint w3wpprocesses.
Clive's investigation
The CLR is fairly keen on generating efficient code, and so, if you don't have a debugger attached at the time the code is JIT-ed, it's going to do its very best to generate fast (and therefore undebuggable) code. If you later attach a debugger, the CLR as it currently stands generally won't re-JIT methods, so the debugger is not going to give you a very good debugging experience.
This became clear recently when I did some experimenting on debugging SharePoint using Reflector VSPro. I'm no expert on SharePoint, and it took quite a while to get a virtual machine together. Moreover, running SharePoint inside a VM on my work machine brings the machine to a crawl. But we learned a lot from the debugging experience, and I'm going to walk you through it.
Setting up, and having problems
Initially, I kicked off a web site and watched the w3wp.exe instances being created using Process Explorer:

To enable debugging, I then decompiled the SharePoint assembly using Reflector VSPro:
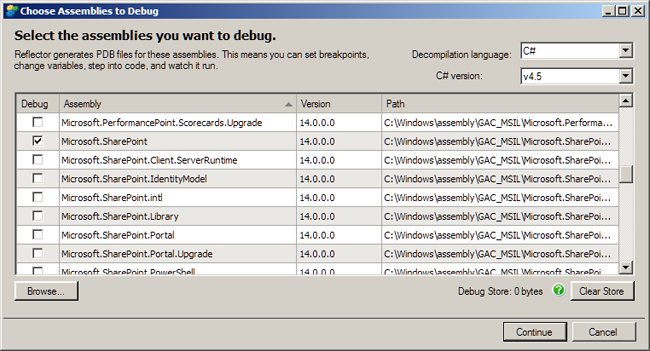
There were a couple of methods that couldn't be decompiled:
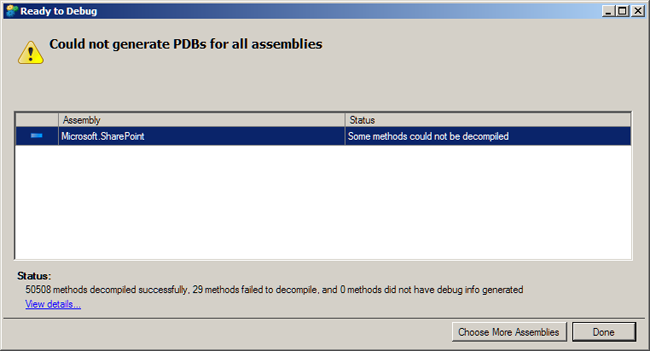
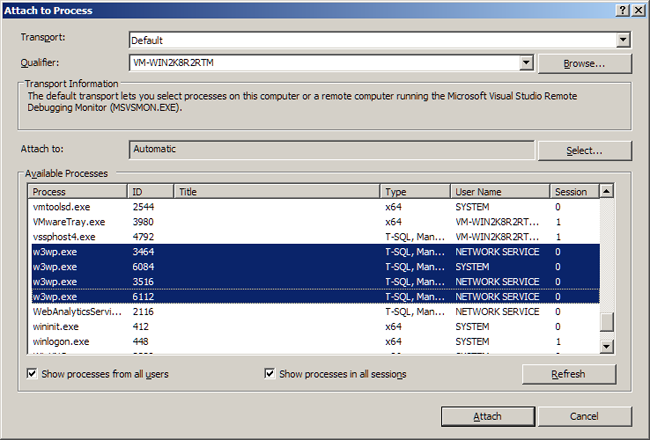
But it's still possible to attach the debugger to the four worker processes, and start to look at what's going on:
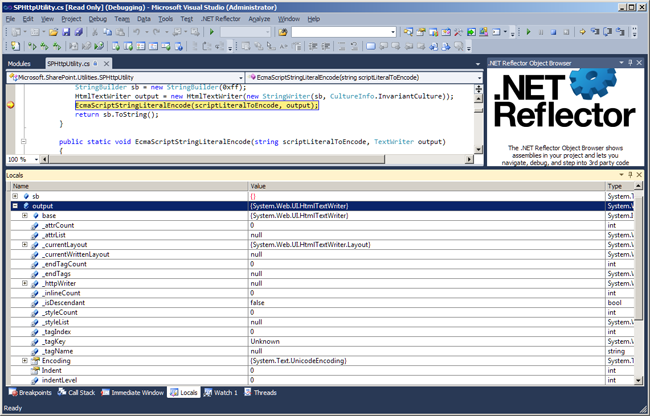
In order to start debugging, I needed to locate a source file corresponding to a class that I knew was going to be called. So I navigated into the Reflector cache directory and found the file SPHttpUtility, which I knew would contain the code for the class of the same name.
Finding this in Visual Studio, I set a breakpoint on one of its methods:
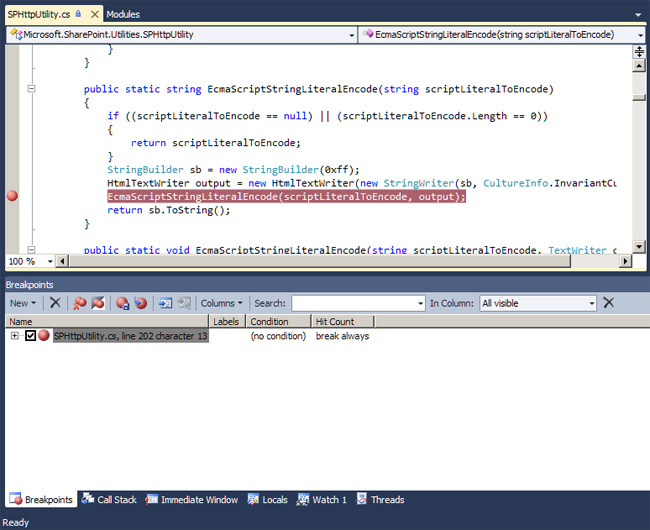
I then used a web browser to get the SharePoint to execute the code. Imagine my dissatisfaction when the debugger couldn't display the local variable values:

Without the local values, we can't follow the flow of data through the code, and we can't debug as accurately as we would like.
Enabling debugging for SharePoint locals
One problem is that SharePoint is made up of ngen'ed assemblies, and you can't see what's going on in that code. The assemblies are loaded automatically by the CLR, and so prevent us debugging.
Disabling optimizations with COMPLUS_ZAPDISABLE
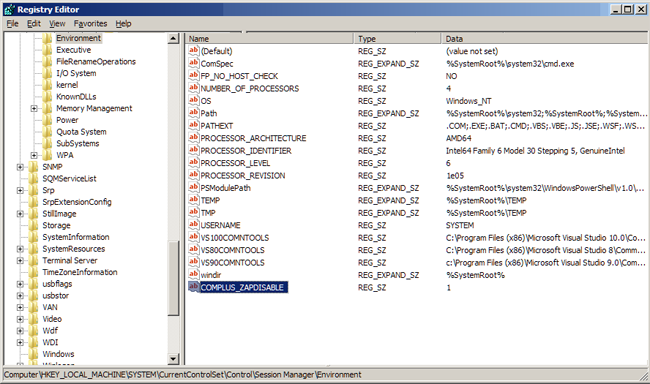
To see the locals, we need to prevent the CLR loading the ngen'd assemblies. Fortunately, this can be done by setting theCOMPLUS_ZAPDISABLE environment variable in the process that loads the CLR itself.
This issue is also documented in the MSDN blog post: How to disable optimizations when debugging Reference Source
With IIS, I find this easiest to do using the registry entry described in this article on improving the debugging experience.
The environment variable prevents the CLR loading the precompiled version of an assembly. If you set this entry, you'll need to restart the various worker processes, and a useful trick is to use process explorer to check that the environment variable is set in the process, by using the properties tab in the context menu when the process is selected
Preventing optimization with .ini files
The second problem is that the methods were JIT-ed before the debugger was attached, and hence the code is optimized to some extent. The trick now is to use a .ini file, which the JIT will detect and which can be used to override the optimization level specified in the assembly itself.
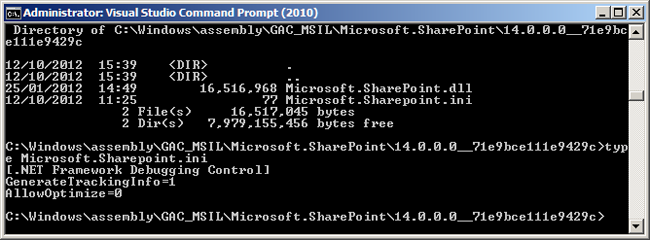
I went into the GAC, using the Modules window inside Visual Studio to determine where the assembly was actually loaded from. I then made a .ini file, named just as the assembly but with the extension ini instead of dll, and containing the following three lines:
In order to try this again, I recycled the w3wp.exe processes – in my case by using Process Explorer to kill them, although recycling IIS might have been a slightly tidier way to do it. I then hit the web page, let them start up and attached again.
This time, at the same breakpoint, we can see all of the variable values because the code is now unoptimised:
Conclusions
There are two things to take away, if you want to debug into the SharePoint assemblies, with all the locals visible:
- Prevent the loading of precompiled assemblies
Set the
COMPLUS_ZAPDISABLEenvironment variable in the registry - Prevent the optimization of loaded assemblies using the JIT
Create .ini files in the same locations as the .dll files you're looking at.
This will give you a much better debugging experience, even if you attach the debugger to the process after it has started.
In my tests there was no impact on system stability, and it's easy to remove the files and re-set the variables when you're done.
This documentation contains proprietary information and is protected by copyright law.
Copyright © 2026 Red Gate Software Limited. All rights reserved


