How SQL Monitor works
Published 14 February 2023
SQL Monitor comprises a Base Monitor and a website. The Base Monitor is responsible for gathering, storing, and alerting on data. It stores and manages the data in the SQL Monitor database. The website displays all this data in a user-friendly format accessible from a web browser. Users of the website provide login details to view monitoring data, as well as to administer the monitoring service. SQL Monitor is atypical of server-based monitoring tools in that it doesn't require the installation of an Agent service on each monitored server. Instead, SQL Monitor uses the existing industry-standard systems for accessing remote computers, WMI for Windows and SSH for Linux, and it interrogates the SQL Server service conventionally using T-SQL via TDS. The WMI protocol used by SQL Monitor can either use DCOM or WinRM for transport.
The following diagram depicts a 3-server installation of SQL Monitor, with the Web Server, Base Monitor and SQL Monitor databases all installed on dedicated machines:
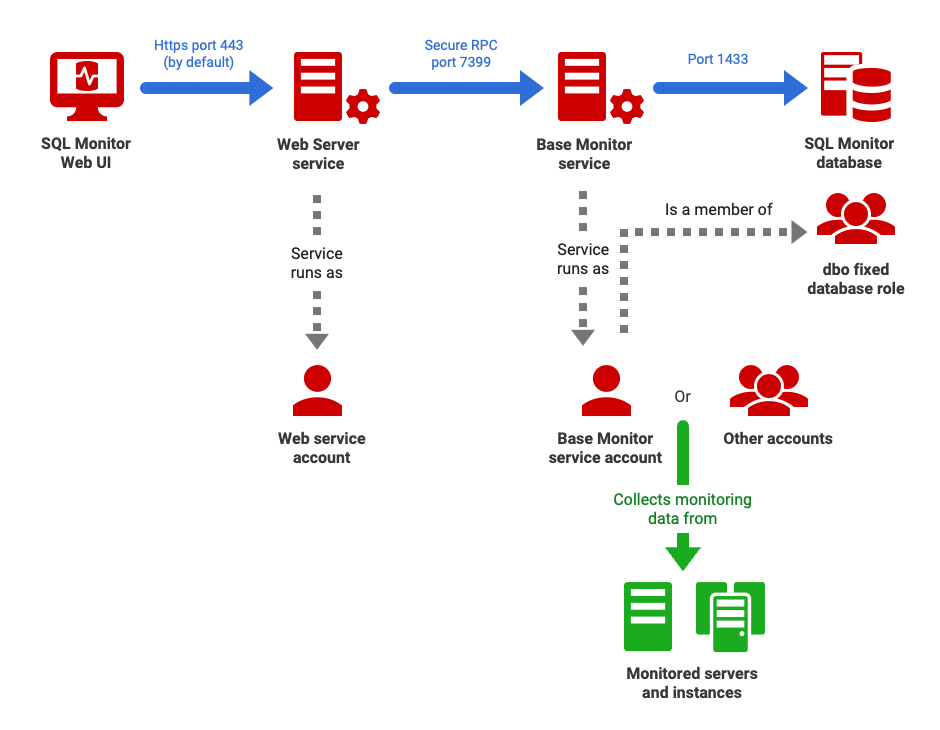
Therefore, when installing SQL Monitor you will need to set up these three logical components of the monitoring service, as follows:
- Web Server – runs the Web Server service, hosts the SQL Monitor web console.
- The Base Monitor service – a Windows service that continuously monitors the servers and instances, wherever they are located, collecting, storing, and transmitting the monitoring data (metrics and alerts).
- SQL Monitor database (also called the data repository) – a SQL Server database used by the Base Monitor for storing and managing the sampled metric and alert data, as well as SQL Monitor configuration settings. It is called RedGateMonitor by default.
The simple SQL Monitor architecture shown can be extended to meet local requirements or to scale up to heavier use. For example, when monitoring many servers, geographically dispersed or on a heterogeneous network, it can be wise to create secondary Base Monitors in order to reduce latency, bandwidth or to satisfy security constraints. Each Base Monitor can handle around 250 monitored instances. See Multiple Base Monitor installations for details.
Encrypted communication
Encrypted communication can be used between the Redgate Monitor components, and in Redgate Monitor's communication with the database environments it monitors, to protect the security and integrity of the system. This includes the following (the ports given are the defaults, which can be overridden):
- From the Web Browser / PowerShell client to the Web Server using HTTPS (port 443)
- From the Web Server to the Base Monitor service using Secure RPC (port 7399)
- From the Base Monitor to the SQL Server data repository using SSL encrypted sql connections (port 1433)
- Connections to monitored SQL Server database instances using SSL encrypted sql connections (port 1433)
- Connections to monitored Windows host machines via WinRM https (port 5986)
- Connections to monitored Linux host machines via SSH (port 22)
- Connections to other environments including VMWare ESXi and Amazon's AWS api using https (port 443)
About the Web Server
The Web Server runs the web service, allowing access to SQL Monitor through users' web browsers. It also provides an interface with the PowerShell scripting API.
Web UI
- SQL Monitor's web interface provides an easy, convenient way to access aggregated, estate-wide views of monitored servers and deep-dive diagnostic information.
- Presents the metric and alert data to users, in the form of various graphs, projections, tables, reports and charts.
- Allows users to view monitoring data, and administrators to manage monitored servers and configure SQL Monitor.
Web Server service
- Connects over secure RPC to its Base Monitor to request the monitoring data, and to authenticate users.
- In response to these requests, the Base Monitor retrieves and interprets the stored monitoring data and sends to the Web Server service the data streams required to populate and refresh the web interface.
- The Web Server service account must be able to connect to the Base Monitor, and have sufficient local permissions to allow SQL Monitor to run the web service. See Permissions required for the SQL Monitor Service accounts for details.
About the Base Monitor
The Base Monitor is the core component of SQL Monitor. This service will connect to each of the machines and instances that you wish to monitor, and will run a series of data collection tasks on each "target", which samples the values for a range of machine-, instance-, and database-level metrics. The Base Monitor stores and manages the collected monitoring data and alert information, as well as configuration settings for the monitoring service, in its SQL Monitor database.
It connects to monitored Windows machines over WMI, via WinRM (http/https) or DCOM, using WMI Query Language (WQL) to sample machine monitoring data, including virtual machine and virtual machine host metrics, and to detect running SQL Server instances. It connects to Linux machines over SSH and accesses a limited number of system views and commands to obtain machine performance data. This includes time series metrics for CPU, memory, and disk usage, details of system processes and server properties and settings. It collects instance and database-level metrics, including time series counters, query information, wait statistics, backup details, and more, using a mixture of WMI plus SQL queries that access various SQL Server Dynamic Management Views and system catalog views, tables and properties. It may also need to run DBCC commands, enable traces, and so on.
The Base Monitor, as well as connecting to monitored machines and the SQL Monitor database, will also need connections to perform the following tasks:
- Authenticating SQL Monitor users – the Base Monitor service is normally configured to query Active Directory to validate user credentials, otherwise they are validated by role and password.
- Communication with Redgate infrastructure services – to perform license activation, check for SQL Monitor updates, send general usage telemetry, and retrieve data on new SQL Server patches.
- Sending alert data to other systems – it will need to connect to email systems, Slack channels, or via webhooks, to service management systems such as ServiceNow, Microsoft Teams, Jira or ZenDesk.


