Editing custom metrics and alerts
Published 07 October 2020
You can change any of the original settings for a custom metric and alert, for example to collect metric data from additional databases, or to alter the alert threshold settings.
- Click on the the row for the metric you want to edit, or select Edit metric from the Actions list for that metric:
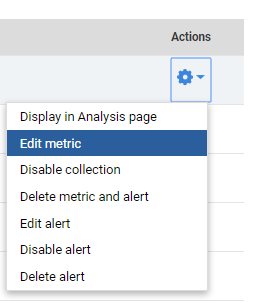
- The Step 1 – Edit metric page displays the current metric settings. If you want help updating this page, see: Step 1. Define metric.
- Once you've edited the metric definition, do one of the following:
- Click Save changes to close the wizard and display the Custom metrics page.
- Click Next to display the Step 2 – Edit alert page, edit the alert settings and click Save changes. If you didn't create an alert earlier and want to do so now, turn on the Add a custom alert for this metric checkbox. If you want help updating this page, see: Step 2. Add an alert.
Changes to the custom alert will affect the alert at the All Servers level. To edit custom alerts at different levels, click Configure alerts above the Actions column to display the Alert settings page, and drill down through the objects in the Monitored servers list. For more information, see: Configuring alerts.
If you didn't create a custom alert when you first created the metric:
- Click the
 Actions button at the end of the row for that metric and select Add an alert:
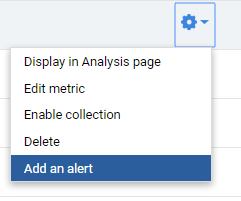
- The Step 2 – Add alert page is displayed. If you want help updating this page, see Step 2. Add an alert.
- Click Save changes.
Displaying a custom metric in the Analysis page
To display the analysis graph for an existing metric, click the ![]() Actions button at the end of the row for that metric and select Display in Analysis page. The data points will be plotted according to the collection frequency specified for the custom metric.
Actions button at the end of the row for that metric and select Display in Analysis page. The data points will be plotted according to the collection frequency specified for the custom metric.
Selecting multiple metrics and alerts
You can apply certain actions to multiple metrics, rather than having to repeat actions for each one in turn.
To select multiple metrics:
- Turn on the checkbox at the start of the row for the metric you want to select.
- Use Shift + click to select a block of metrics.
Selected metrics are highlighted in the list by row color:
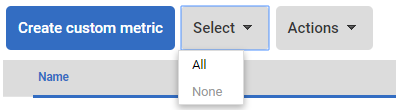
To select or deselect all metrics more quickly, choose All or None from the Select drop-down list near the top of the page:
Enabling or disabling metric collection
You may want to temporarily disable a metric, for example if you need to carry out maintenance work on the server from which data is collected. The collection status for each metric is displayed on the Custom metrics and alerts page as either ![]() for enabled or
for enabled or ![]() for disabled.
for disabled.
To enable or disable metric collection:
- For single metrics, click the
 Actions button at the end of the row for that metric and select Enable|Disable collection.
 - For multiple metrics, select them and then choose Enable | Disable collection from the
 Actions drop-down list near the top of the page:
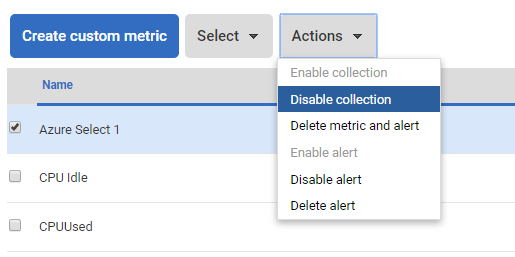
The status is updated and a confirmation message is displayed at the top of the page:

What happens to alerts associated with disabled metrics?
If data is no longer being collected for a metric, SQL Monitor cannot raise associated alerts. It does not matter if the alert itself is in an enabled state; alerting can only resume once metric collection is enabled. You don't have to disable the alert associated with a disabled metric.
Enabling or disabling alerts
You may want to disable an alert, for example, if a significant number are being raised in the Alert Inbox, and you'd like to temporarily stop receiving alerts for that metric while you change the thresholds or threshold duration settings. You can still collect metric data so that you can analyze it further using the Analysis page.
To enable or disable metric collection:
- For single alerts, click the
 Actions button at the end of the row for that metric and select Enable|Disable alert.
 - For multiple alerts, select them and choose Enable | Disable alert from the
 Actions drop-down list near the top of the page.
The status is updated and a confirmation message is displayed at the top of the page:

Note: These changes will affect this custom alert at the All Servers level. To enable or disable custom alerts at different levels, configure the alert using the Alert settings page (Configuration > Alert settings). See: Configuring alerts.
Deleting custom metrics and alerts
If you want to remove custom metrics that are no longer needed, delete them from the Custom metrics page. This also removes them from the Alert settings page, and deletes existing occurrences from the Alert Inbox.
Deletion of custom metrics and alerts is a permanent action that cannot be reversed. If you want to temporarily suspend metric collection or alerting, you should disable them so they can be enabled later.
- Choose what you want to delete:
- To delete a single metric, alert, or metric and alert, select the relevant Delete option from the
 Actions list.
 - To delete multiple metrics, alerts, or metrics and alerts, select the metrics and choose the relevant Delete option from the
 Actions drop-down list near the top of the page.
- To delete a single metric, alert, or metric and alert, select the relevant Delete option from the
- The Delete box is displayed, confirming what will be deleted:
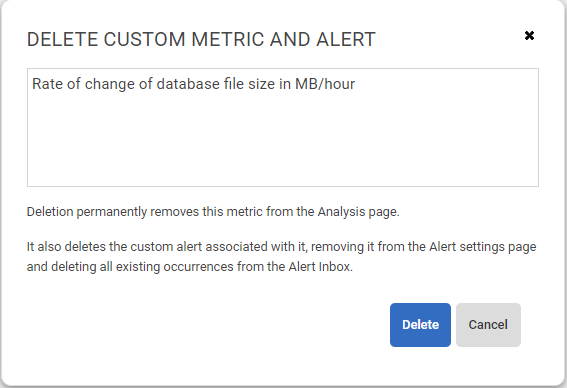
- Click the Delete button. The metric is removed from the Custom metric page, and a confirmation message is displayed:

This documentation contains proprietary information and is protected by copyright law.
Copyright © 2026 Red Gate Software Limited. All rights reserved


