Using the SQL Monitor metrics website
Published 21 October 2021
We've created a website: http://sqlmonitormetrics.red-gate.com/ containing a range of custom metrics and alerts that you can install automatically.
The following Redgate University videos explain more about the SQL Monitor metrics website.
- Community metrics video – review of community custom metrics and how to install one into SQL Monitor.
- Capturing business information video – examples of using custom metrics to monitor important business processes.
Installing cookies
Before you can install metrics automatically from the website, you need to install cookies. To do this:
- Ensure that cookies are enabled in your web browser.
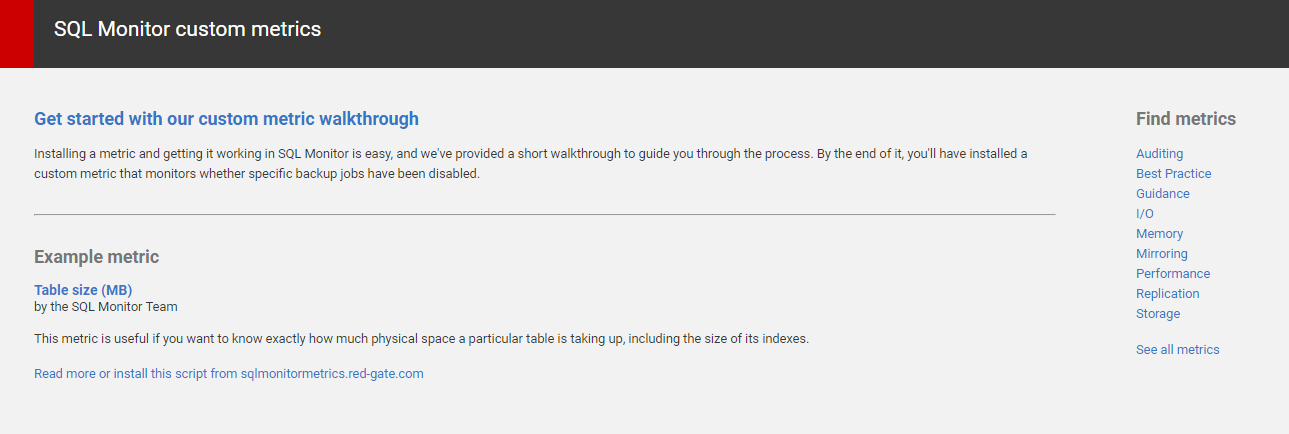
Go to the Configuration > Custom metrics page and click on one of the links to the website. A panel displayed near the bottom of the page provides links and information about the site content:
Cookies are installed once you've launched the site from one of these links.
Installing metrics automatically
Details of how to install metrics on the website, directly into SQL Monitor, are provided on the site's 'guides' page.
Once you've found a metric on the site and clicked the Install metric... button, a new Create custom metric wizard in SQL Monitor is automatically populated with the relevant metric and alert settings. The Step 1. Define metric page is displayed, so you can review and update settings that may need changing to get the metric working in your environment. Settings that need updating have notes attached to them on the website's metric pages, for example:
If you need help completing the wizard pages, see Step 1. Define metric and Step 2. Add an alert.
Once settings have been updated, click through to the Summary page and click the Create metric or Create metric and alert button. The new metric is displayed on the Configuration > Custom metrics page.


