Diagnosing Deadlocks
Published 21 October 2021
SQL Monitor includes a built-in alert, called Deadlock (Extended Events). Whenever a deadlock occurs, SQL Monitor captures the Extended Events Deadlock Graph, showing in graphical form, as well as in raw XML, all the details of the deadlocked processes. SQL Monitor provides the context you need to understand SQL Server activity at the time of the deadlock. This gives you the full picture of when and why the deadlock occurred, which other processes are affected, and provides the information needed to prevent the problem from recurring.
What is a deadlock?
A deadlock occurs when two or more queries need exclusive access to different tables and each query is waiting for the other to finish. Every process in the deadlock is waiting for another process in the deadlock, but none of them can complete!
How does SQL Server resolve deadlocks?
SQL Server has a lock monitor that auto-detects deadlocks by periodically checking for the existence of any circular locking chains. This deadlock detector will resolve the deadlock by killing one of these processes (the deadlock victim), and rolling back its transaction, therefore releasing any locks it held. SQL Server will pick the query with the lowest cost to roll back as the victim. If you’re lucky, this will be a SELECT statement. By killing off a process in the deadlock graph SQL Server allows the other processes in the deadlock graph to continue executing.
The process running the deadlock victim receives the 1205 error message.
Transaction (Process ID XX) was deadlocked on resources with another process and has been chosen as the deadlock victim. Rerun the transaction.
How should deadlocks be handled?
Firstly, the developers need to ensure proper handling of the 1205 exception, to avoid UnhandledException errors in the application. Whether this is done using a BEGIN TRY/CATCH block inside the SQL being executed, or within the application code, the most common approach is to pause, and then retry the transaction a set number of times.
Secondly, when the deadlock error occurs, the underlying cause must be investigated. Deadlocks are disruptive to the deadlock victims, prevent forward progress of other queries, and cause applications to misbehave. By identifying the what's causing the deadlock, we can then go on to improve the overall database performance.
Deadlocks revealed, in SQL Monitor
SQL Monitor raises an alert when a deadlock occurs. Clicking on the deadlock alert from the alert inbox will leads to the Alert Details page.
Deadlock alert details
The Details tab of the Alerts screen shows a graphical depiction of the deadlock graph:
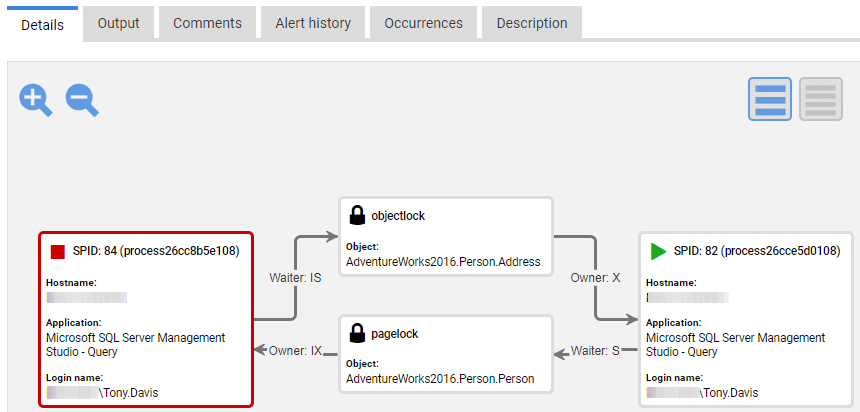
The source of the Extended Events XML Deadlock Graph is fully available in the Output tab but the graphical version makes it easy to see the critical details:
- Processes 84 and 82 are deadlocked:
- Process 84 needed to acquire a lock on the
Person.Addresstable, to read it, but was blocked since process 82 held an X lock on this object. - Process 82 needed to acquire a lock on a page in the
Person.Persontable, to read it, but was blocked since process 84 held an IX lock on this page. - The red border indicates that SQL Server chose process 84 as the deadlock victim and rolled it back. SQL Server's lock monitor chooses the suspended thread that was running the process with the lowest rollback cost.
- For each process, you can see the machine, application, and login name for the client who issued the SQL batch.
Click on either of the processes to see additional diagnostic details including the text of the SQL batch issued by that process. In this case, process 82 issued a batch to execute a stored Procedure called Person.UpdateAddressDetails, and that the last SQL statement executed was a SELECT * query on the Person.Person table:
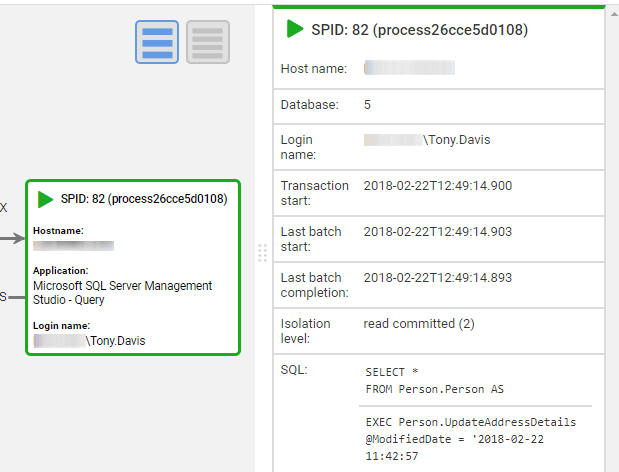
Likewise, an examination of the deadlock victim shows that it was executing an UpdatePersonDetails stored procedures, and the last SQL statement it issued was a query on the Person.Address table.
Performance data
SQL Monitor shows the deadlock data within the full context of the activity occurring on the SQL Server instance around the time of the error. Scroll down on the alerts screen and you’ll see performance data, arranged by tabs, showing snapshots and summaries of resource usage at the time of the alert, as well as details of SQL Server queries and other server-level processes.
The Top queries tab shows queries that were executing around the time of the alert. This list will likely include the queries and procedures involved in the deadlock. Clicking on one reveals the text of the query, a link to view its query plan, from the plan cache, and a list of any significant waits associated with the query.
Common deadlock conditions, root cause analysis and resolution
With knowledge of the queries involved in the deadlock, and of concurrent activity on the server, you can take steps to resolve the problem, to ensure it does not recur. This might involve query tuning, adding a new index, or modifying an existing one, or some other standard mitigation for deadlocks, which are often similar to those for resolving blocking. Often the cause is unnecessary transactions, held open for too long, or containing statements that have no need to be in there.
Certain types of deadlock have a specific pattern, and therefore a "footprint" in the deadlock graph for which you can look out.
Key Lookup deadlocks
Key lookup deadlocks (often called bookmark lookup deadlocks) generally occur when a SELECT statement that uses a non-covering index runs at the same time as an INSERT, UPDATE, or DELETE on the clustered index. You can verify the presence of a Key Lookups for the deadlocked SELECT by reviewing its execution plan in SQL Monitor.
The modification process must acquire exclusive locks on the clustered index and then the non-clustered index, and the SELECT must acquire shared locks on first the non-clustered and then the clustered index. This can lead to a deadlock, and the SELECT will be the deadlock victim.
The simple fix is usually to change the definition of the non-clustered index so that it covers all the columns the SELECT needs, either as additional key columns or as INCLUDE columns.
Update Order deadlocks
The footprint of this type of deadlock in the deadlock graph, is two processes that each update and then query the same two tables, in a different order, each within an explicit transaction. A common resolution, where possible, is to reverse the order of either, or both, sets of statements. When using explicit transactions in code, it is important that objects are always accessed in the same order, to prevent this type of deadlock from occurring. You might also request the application developers investigate whether the explicit transaction necessary in one or both of deadlocked processes. i.e., do they involve multiple data modification statements that must form an atomic unit?
Upsert deadlocks
This deadlock can be complex to resolve and involves running procedures that first check for the existence of a key value and performs either an update or insert. These operations are often run within a SERIALIZABLE transaction to prevent Primary Key violations but are then prone to deadlocks.
An indicator of this issue is the appearance of Range lock modes in the deadlock graph. More generally, you can also look out for processes using elevated transaction isolation levels in the process details of the deadlock graph.
You might consider whether use of these elevated isolation levels are really required, or evaluate use of SNAPSHOT isolation as a possible alternative. However, like READ_COMMITTED_SNAPSHOT, it can cause applications to behave differently so requires thorough investigation and testing by the application developers.
For advice on dealing with "Upsert" deadlocks, see SQL Server UPSERT Patterns and Antipatterns.
Useful References
- Monitoring and Troubleshooting Deadlocks with SQL Monitor, Product Learning article with worked example
- SQL Server Deadlocks by Example, Simple-Talk article by Gail Shaw
- Handling Deadlocks in SQL Server, Simple-Talk article by Jonathan Kehayias
- The Difficulty with Deadlocks, a good review of what causes deadlocks and how to handle them.
This documentation contains proprietary information and is protected by copyright law.
Copyright © 2026 Red Gate Software Limited. All rights reserved


