Tracking Disk Space Usage and Database Growth
Published 21 October 2021
It is rare for a database to suddenly run out of space. These events are predictable if you are aware both of changes to the free space on the storage and the rate of data growth. SQL Monitor automatically tracks a range of metrics for disk space use, database size, and database file growth for all monitored machines (including Amazon RDS machines), clusters, and Azure SQL Databases.
How to track space utilization in SQL Monitor
You can view and analyze SQL Monitor's disk space and database growth metrics per instance, per database, and per file on the Server Overview and Analysis pages. You can review trends in this data across all servers on the Estate > DiskUsage page.
SQL Monitor can also raise alerts on Free disk space, Unallocated space in a database file, and on Database file growth. With a single view over the behavior of each of these metrics and alerts you will:
- Reduce unplanned downtime caused by unexpectedly running out of disk space.
- Increase the time available to react to database growth. If you can predict when a database is going to need to grow, you can schedule in maintenance time, to increase capacity, at a point when it will have the least impact on your business.
- Avoid file auto-growth occurring at unpredictable times, when it could block and disrupt important business processes
- Investigate and fix any problems that may be causing excessive database growth.
The result is less disruption to business processes and a drastic reduction in time spent on ad-hoc disk space management.
1: Use the built-in disk space alerts
SQL Monitor tracks space utilization on the disk volumes holding:
- The data and log files for of each user and system database, and
- The database backups and log backups
If a database’s data file is unable to grow SQL Server will raise an 1105 error and the database will become read-only until more space is made available. If the transaction log file is unable to grow SQL Server will raise a 9002 error. This again puts SQL Server into read-only mode; if a log file cannot grow during database recovery SQL Server will enter resource pending mode. SQL Monitor's built-in disk usage alerts are the DBA's final line of defense against this unplanned downtime and they need to be configured correctly for each monitored server, or for each group of servers, so that you have sufficient time to respond and make more space available. For database servers that support critical applications and services, you can configure multiple thresholds for these alerts so that alerts escalate though from low or medium to high as space on the drive diminishes further:
Disk space alert
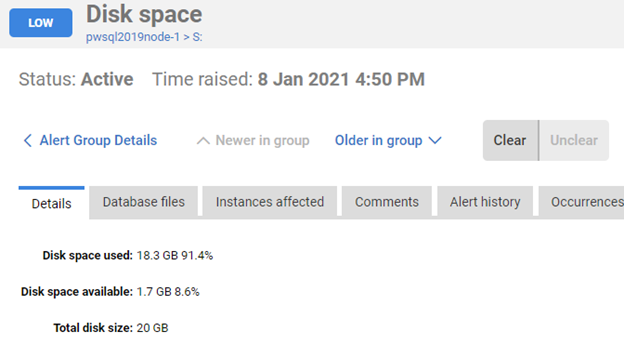
The Disk Space alert will warn when used disk space rises a above a threshold percentage value, or when available disk space falls below a threshold amount (in MB or GB). When the alert fires, you'll see the details of the affected drive volume, with tabs indicating which database files, if any, are stored here and the list of instances that will potentially be affected.
Azure SQL Database: Database Space Limit Alert
Fires when either the total database size (used space) is above a percentage threshold per Azure resource limits or space available is less than a fixed value for longer than a specified duration.
2: Use the Disk Usage Estate page
The Disk Usage page of the Estate section provides a single place to monitor current disk space usage, see projected growth trends, and plan capacity requirements, across all servers. On this page, you'll find a summary for current and projected disk space consumption, with the ability to drill down to see how space is allocated and used on any individual disk volumes, for each SQL Server instance.
This single, estate-wide view will make it easier to plan capacity requirements and identify which host databases rarely grow, grow predictably, or are prone to sudden growth. For the latter category, consider setting up alerts on database file space use, and physical file growth, and then investigate the main causes of unexpected growth.
The Disk Usage page can be filtered by server group (such as "production" or "test"), disk volume or on the server name and it provides the following details:
- Disk Usage summary graph - An aggregate view, across all monitored servers, showing the current total disk capacity, recent growth in disk space use, and projected growth over the coming months.
- Detailed space usage table, sortable on any column, showing current and projected disk space use for the disk volumes serving each monitored SQL Server instance
- Warning triangles on the Projected space use in one year column indicate disk volumes that are forecasted to require more space than is currently available on the disk
- Sorting by Time until full will also help understand which instances have higher data growth rates and prioritize capacity planning work.
- Per volume drilldown graphs and tables showing:
- How much space on a drive has been allocated to data and log files, how much of it is used, and how much space is used by other files and processes
- Details of the current size of each database and log file on each volume, and the used space within each. This will tell you which databases are 'hogging' space, and whether any space can be reclaimed such as due to outsized log files.
There are additional sources of disk usage information in SQL Monitor:
- Server Overview page, Disk Usage section provides a bar chart of space used per disk volume, for that instance, alongside sparklines for disk performance metrics, including average disk read and write times and disk transfer rates.
- Reports page - the built-in fastest filling disks report tile indicates the SQL Server instances with disk volumes closest to being full, showing percentage fill, and projected days remaining till full
3: Track use of database file space
SQL Monitor tracks the available space in data files and alerts you when it's almost depleted, with a projection, based on recent trend analysis, of how much extra space will be required to accommodate a year's growth. This gives the team more time to investigate causes of growth, and plan expansion, and over time will lead to better file sizing, and less reliance on file auto-growth and this disruption can cause.
Track free space in data files
As data is inserted, free space within the data file will be allocated to the tables and indexes storing that data. When the data file is full, it will need to grow. By tracking space use in database files over time you’ll understand the growth characteristics for each database and be able to size the files more accurately to accommodate future data growth.
SQL Monitor will track data file use via the built-in database file usage metric. The idea behind this metric is to warn you well in advance when a database file will need to grow. Rather than wait until the file auto-grows, you have time to study the trend is growth, the cause of any abnormal growth, and plan in maintenance time to grow the file.
You can choose to alert when one of three different thresholds are breached for a database’s data file:
- Time Remaining: This is the default. Time Remaining is calculated by deriving a line of best fit using 30 days of data for the data file and using this linear regression to project forward to the file's current size. The alert will be raised if the linear regression predicts that the file will become full within the configured interval.
- Percent Full: Raised when space used in a data file is above a specified percentage.
- Space Remaining: Raised when the available space is less than a fixed amount.
For example, you can choose to receive an alert when the time until the file is predicted to be full is less than 2 weeks, or it reaches 90% capacity, or less than 500 MB is available. When the alert fires, it provides diagnostics such as the current file size, percentage of space used, a file usage history graph, and a projection of the required size increase, based on recent growth trends.
Track free space in log files
Since the log file use patterns are not predictable based on historic growth, the database file usage alert is disabled for log files but there is a custom metric to measure used log space, if required: Percentage of used log space. In any case, you do need to track unexpected log growths (see Log file growth).
Custom metrics for file space usage
4: Track database size and physical file growth
SQL Monitor will help you track database size, and you can install simple custom metrics, suited to your system's requirements, to track physical file growth.
If initial data and log sizing is done correctly, and you are monitoring file usage, then increases in physical file size will be anticipated. However, it is hard to project data storage requirements for new databases and even established databases can sometimes grow unexpectedly. Unanticipated data imports, software bugs, maintenance operations, and more can all cause unexpectedly rapid growth.
While autogrowth should be enabled for database files as a ‘safety net’, to accommodate cases of unexpectedly rapid file growth, reliance on autogrowth is not a good file size management strategy. File autogrowth events can consume a lot of system resources. If autogrowth occurs during a busy period, it can cause blocking and disruption of application processes. In other words, when auto-growth occurs, you need to be aware of the it, and to investigate the cause.
Track database size
The Databases section of the Server Overview page gives total file sizes and space usage for data and log files, for each database on the instance, as well as location, size, space usage and file configuration details (max size, filegrowth increment etc.) for each file.
Custom metrics:
- Total database file size - collects and analyses data from
sys.database_filesto detect a change in overall database size (data and log files). - Database autogrowth - for selected instances, uses the default trace to count number of database autogrowth events (data file or log file) in the last hour.
- File size change - a custom metrics that captures changes in size of data or log files on an instance, using data from an Extended Events session that captures the
database_file_size_changeevent.
Track data file growth
By default, SQL Server data files must zero out disk space during file growth. SQL Server can be configured to use instant file initialization. Instant file initialization allows SQL Server to grow a data file without having to initialize the free space to contain only zeroes. This makes each growth event relatively efficient, but if the file needs to expand frequently, it can still cause problems: other database processing must pause until the growth event completes. Over time, frequent file growths can also lead to physical file fragmentation.
The previously described database file usage metric and alert gives you the diagnostic data you need to monitor data file growth, as well as space use within the file. However, you can also use the database file size custom metric, which collects values from the sys.dm_os_performance_counters Dynamic Management View (DMV), to track changes in data file size.
Track log file growth
We also need to monitor growth of the transaction log for each database. Transaction logs can grow significantly during activities that modify a large amount of data. Some examples are large-scale data changes such as caused by long-running data purge or archiving processes, or database maintenance operations such as index rebuilds or reorganization, statistics updates, or by uncommitted transactions preventing space reuse in the log.
In contrast to data files, transaction log files cannot take advantage of instant file initialization making each log growth event relatively expensive in terms of time and resources. While the log growth is happening no other transactions will be able to use the transaction log until the log growth completes. An associated problem with uncontrolled log growth, especially when the log file is configured to grown in small increments, is that it can lead to log fragmentation, where the log is composed internally of a very large number of Virtual Log Files (VLFs). This can degrade the performance of operations that read the log, such as log backups, or replication and mirroring processes. It can also slow down crash recovery, because SQL Server must open the log and read each VLF before it starts recovering the database.
SQL Monitor will help you understand the log growth characteristics and behavior on your own system and set the file size and autogrowth size accordingly and so avoid expensive autogrowth as well as log fragmentation.
In addition to the database growth metrics above, SQL Monitor offers a custom Large transaction log files metric that alerts when the number of databases with a large log (over 10 GB, but configurable) increases. If you detect problems of log growth for certain databases, you will need to investigate possible causes, such as:
- Something is preventing reuse of log space - you can query the log_reuse_wait_desc column in sys.databases, to find out what. It is often due to either a long-running transaction, or a lack of log backups (SQL Monitor should have alerted you to that too!), but there are other possible causes.
- The log backup frequency is insufficient to control log size
- Large scale data operations - it is a good practice to run these in small batches, giving the transaction log a chance to truncate in between
- Index maintenance operations - a common cause of excessive transaction log usage and growth, especially in databases using the FULL recovery model. Only rebuild indexes that really need it, and perform reorganization, rather than rebuild, where possible.
- Investigate heavy log-writing transactions - you can use the sys.dm_tran_database_transactions DMV, and others, for this. See, for example, p.125 of http://assets.red-gate.com/community/books/transaction-log-management.pdf
Summary of built-in metrics
Machine metrics (including Amazon RDS machines):
- Disk free bytes - The amount of free disk space available on each disk (in GB).
- Disk used bytes - The amount of space used for each disk (in GB).
- Disk used % - The amount of space used for each disk as a percentage of available disk space.
Cluster metrics
- Cluster shared volume - used%, free%, used bytes and free bytes
File size and space metrics (including Amazon RDS SQL Databases)
- File size - Total space allocated to the data or log file.
- File used - Space used within the specified file.
- Total file size - The total size (in GB) of all data files (.mdf and .ndf) and log files (.ldf) for this database
- Total data file size - Total size of all data files (.mdf and .ndf files) for the specified database
- Data size is the equivalent metric for Azure SQL Databases
- Total data file used - Total usage within all data files (.mdf and .ndf files) for the specified database.
- Total log file size - Total size of all log files (.ldf) for this database.
- Total log space used - Total transaction log file size currently containing log records.
- Log space used % - Percentage of total transaction log file size currently containing log records.
This documentation contains proprietary information and is protected by copyright law.
Copyright © 2026 Red Gate Software Limited. All rights reserved


