Top procedures
Published 01 November 2022
For stored procedures SQL Monitor collects data from the sys.dm_exec_procedure_stats dynamic management object to provide details of stored procedures and their execution statistics (number of times the procedure has been executed, and averages for duration, CPU time, I/O activity, and so on).
By default, tables show data for the graph focus window. This means we can correlate what we see in the interactive timeline, with performance statistics and execution details for procedures, recorded over the same period, which were the principle resource consumers:
You can also display data from a previous time period of your choice using the Back in Time control. For more details, see: Rewinding time with Back in Time mode.
If data isn't available for the selected time period, it may have already been purged from the Data Repository. See: Why is data missing? below.
Top procedures table
The Top procedures table shows the procedures that used the most resources during the selected time period. The data can be updated automatically if you set autorefresh at in the time window.
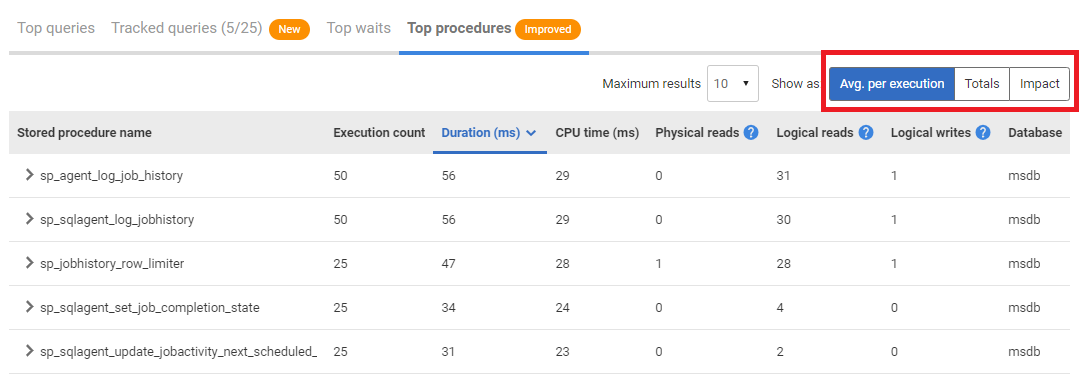
By default, Avg. per execution is selected; this lists procedures based on average values over the time period selected. Click Totals to display procedures based on total values or Impact to display procedures based on procedure impact:
For Avg. per execution and Totals the table shows:
- Execution count – number of times the procedure was executed.
- Duration – how long it took (in milliseconds) to execute the procedure. By default, procedures are listed in descending order according to this metric.
- CPU time – how much processor time (in milliseconds) was used to execute the procedure.
- Physical reads – the number of times a page is read into the buffer cache. If the page is in the cache already, it uses the page already in memory and does not generate a physical read.
- Logical reads – the number of times the database engine requested a page from the buffer cache.
- Logical writes – the number of times data is modified in a page in memory. If a page stays in memory for an extended period, more than one logical write may be required before it is physically written to disk.
- Database – the database the procedure was run against.
To update the table manually, click on a column header containing numeric data.
Selecting one of these options does not simply change the sort order of the existing list of procedures. A new table is generated according to the selected option, so different procedures are likely to be displayed.
For Impact the table shows:
- Procedure Impact - a calculated metric representing the overall impact of a procedure on server.
- Database – the database the procedure was run against.
The table shows the top procedures ordered by impact high to low.
Impact is a calculated metric which represents the overall impact of the procedure on the server. This allows you to identify the procedures which need most attention.
It is calculated from a combination of metrics as follows:
Impact = log((TotalCPUTime x 3) + TotalLogicalReads + TotalLogicalWrites)
What are the queries within the procedure?
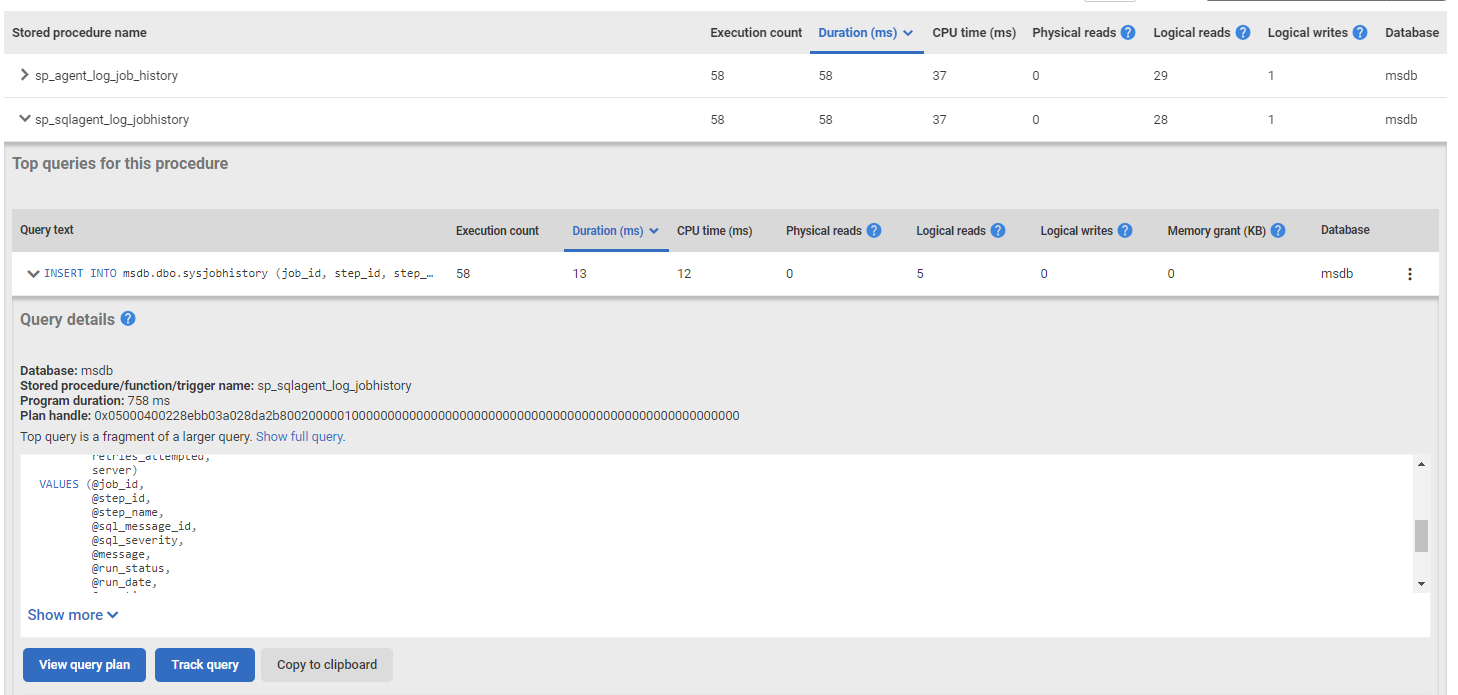
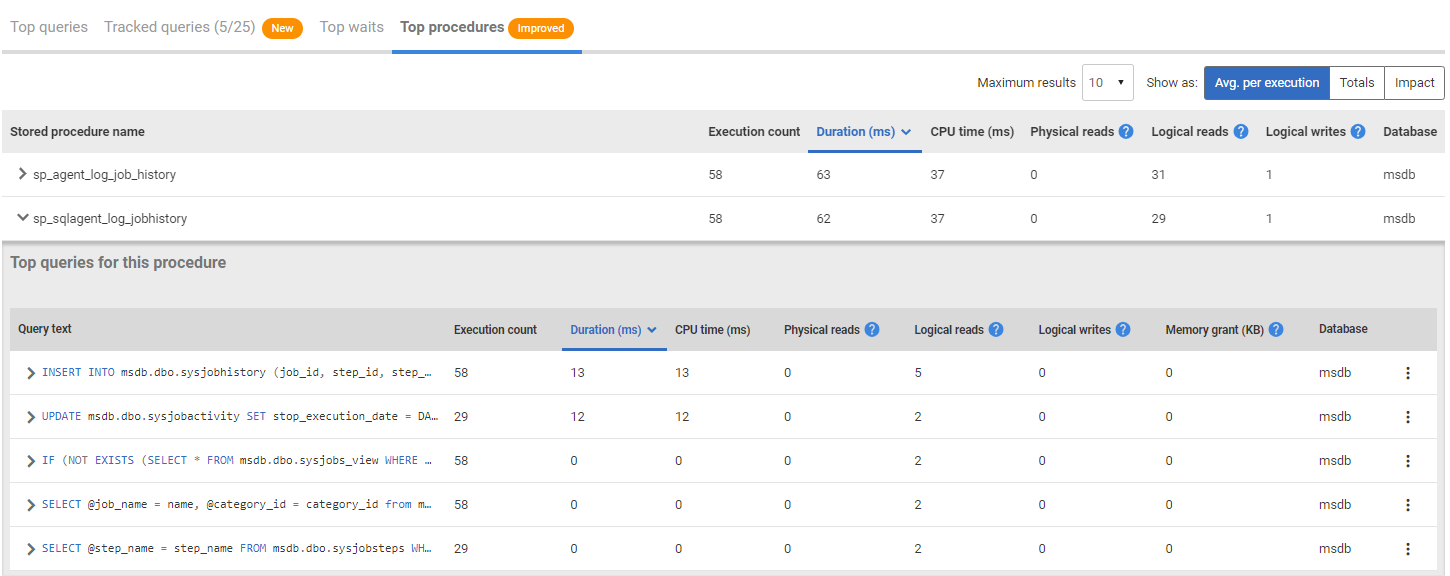
You can find the most expensive queries that ran within the procedure by expanding the stored procedure row. Just like in top queries, the queries shown here have the runtime statistics. They are also expandable and will give you the same detailed view about the query as in top queries.
The list of queries given for a procedure are only the most expensive queries that monitor has identified, and may not include all of the queries or even every run of the queries within the procedure. It is worth noting, because of this, the sum of the given metrics for the queries may not match the procedure metrics.
Why is data missing?
Top procedures may not be available for the selected time period for any of these reasons:
- There was no significant data to capture.
- The data has been purged due to data retention settings.
- SQL Monitor wasn't running.
- The database was unavailable or suspended.
- SQL Monitor couldn't sample the data.
Why are there procedures named "Unknown procedure"?
This can happen if the user that SQL Monitor is using to sample the stored procedure data does not have permissions on this specific database. Adding the Connect any database permission to the monitoring user can solve this issue.
The number at the end of the stored procedure name column state the object id.


