Step 1. Defining the metric
Published 14 February 2023
The sections in Step 1 help you complete the custom metric definition.
Enter custom metric details
Adding a metric name is compulsory, because it is the unique identifier for that metric in SQL Monitor. The name can contain up to 255 characters.
The metric description is optional, but recommended. The text you enter is displayed in the Description tab on the Analysis page to help users understand the metric values. If you want to follow the format of descriptions for existing metrics, include:
- an initial overview of what is being measured.
- the equivalent PerfMon counter (if relevant).
- a more detailed explanation of why the metric is useful, how values are calculated, and what exceptions exist.
- optimal values and dependencies, including examples of baseline values.
- related metrics that may affect or be affected by this metric.
- references to useful TechNet articles or similar sites.
Enter the T-SQL query used to collect data
The T-SQL on which the custom metric is based must return a single, numeric scalar or NULL value. It can call a stored procedure, as long as the returned value meets the same criteria. It must not collect multiple values, results containing alphabetic or special characters, or recordsets.
What cannot be included in the T-SQL query?
Custom metric collection queries are run in a transaction, and use a 300 second command timeout.
You must exclude:
- statements that make a change to the database, for example, INSERT; UPDATE; DELETE; DROP; CREATE; ALTER.
- statements that will affect the performance of normal database operations and may place a burden on the server. For example, do not query against the fragmentation level of indexes.
You should also avoid USE statements that can collect a value from one database and store it against another, potentially incorrect, database. There's another section for specifying databases to collect from, so you don't need to do this in the T-SQL.
Warning: To prevent causing damage to your servers or data, we recommend that you validate and run the query against a non-production database in your SQL Server management software before adding it to SQL Monitor.
Select instances to collect from
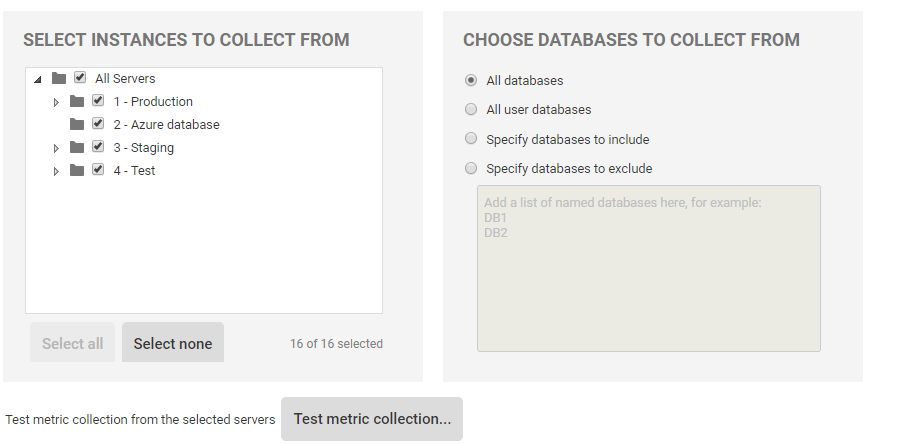
Every instance currently being monitored is displayed in this section. Use the checkboxes to select specific instances from which to collect data, or use the Select all and Select none buttons to make selection easier. Selecting a single instance automatically selects the machine that hosts it and, similarly, selecting the machine automatically selects the instance.
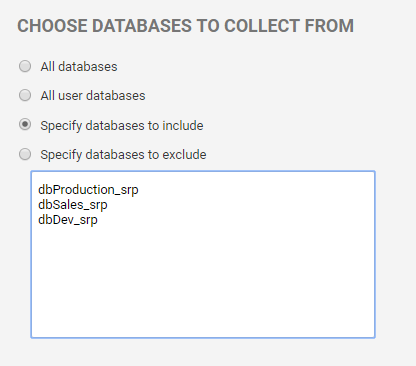
Choose databases to collect from
The query will run once against the databases you select from the following options:
- All databases – every database stored in the selected instances.
- All user databases – every non-system database.
- Specify database to include – every database name that you enter in the associated text box. Enter each name on a separate line.
- Specify database to exclude – opposite to the option above, the query will not run on specified databases. Enter each name on a separate line.
Database names are not case sensitive. If you have databases with names differentiated by the use of upper- or lower-case characters (for example, ProductionXYZ and productionxyz) on two different servers, values will be collected from both databases.
If you are collecting server-level metrics, you should select Specify database and enter master in the text box.
Test metric collection
We recommend testing the T-SQL query in SQL Monitor to make sure that data can be successfully collected from monitored objects within a reasonable duration.
- Click the Test metric collection button. In the displayed dialog, the databases previously specified are selected by default. If you don't want to test every object, change the selection by unchecking the boxes or using the selection buttons below.
- Click the Test metric collection button. SQL Monitor tests the query once against each selected database and displays its progress at the bottom of the dialog.
If an object fails the test, or the duration is significantly longer than expected:
- Check the exception or error messages displayed in the Return value column.
- Make sure the T-SQL query complies with the details listed in the section above called "What cannot be included in the T-SQL query?"
- Check for other problems with the T-SQL, such as invalid syntax or objects referenced in the query that don't exist in the database.
- Check the Monitored servers page (Configuration > Monitored servers) and the Alert Inbox for status errors or alerts affecting servers hosting selected instances.
Once you've fixed any connection or T-SQL problems, retry the test until it completes successfully.
Set collection frequency
This section determines how often the query will run against selected databases to collect data. The collection frequency options available are:
- every minute.
- every 5 minutes.
- every 10 minutes.
- every 30 minutes.
- every hour.
- every day.
For non-daily metrics, the first collection will take place within 10 seconds of the metric being created. Collections are scheduled from the point that the last collection completes, so that for example, if a custom metric collection query takes 1 minute to run and its scheduled frequency is set to every 5 minutes, a data point would be available every 6 minutes.
For metrics with a daily frequency set, an additional input field specifies the time of day when the custom metric should be collected, this input will default to midnight. It is advised to ensure that not all daily custom metrics are sampled at the same time, as this is likely to lead to a sudden spike in resource usage for sampled instances.
Note: The more frequently data is collected, the greater the storage impact on the Data Repository. By default, data older than one week is deleted on an hourly basis. To ensure that the Data Repository doesn't use up too much hard disk space, check the data retention settings for custom metric data. See: SQL Monitor data retention policy.
Use collected or calculated values
Custom metric values are displayed in the analysis graphs as data points. They also form the basis of alert thresholds should you create an alert based on this metric.
By default, SQL Monitor uses the actual values collected after running the T-SQL query. For example, if you're measuring database size in GBs, you want to see the actual GB size at each data point in the Analysis graphs. In most cases, this is the value you're interested in.
If a metric is measuring a property that changes over time, you want to see the rate, not the actual collected value. For example, if you measure the database's daily growth rate in GBs, you're no longer interested in finding out the actual GB size at each data point. Turn on the Use a calculated rate of change between collections checkbox. SQL Monitor calculates the rate for you by finding the difference between each pair of consecutive values and dividing it by the number of seconds between each collection.
Metric collection is Enabled/Disabled
By default, metric collection is enabled, so data collection can start after all three steps of the wizard have been completed. If you want to delay collection, click Disabled. You can enable the metric later using the wizard or the Custom metric page (Configuration > Custom metric).
Once you've completed this page, click Next to go to Step 2. Adding an alert.


