Rewinding time with Back in Time mode
Published 03 December 2012
You can "rewind time" in SQL Monitor to enter Back in Time mode, where you can examine the state of any overview as it was at a time in the past.
While in Back in Time mode, you can step forward or backwards in time to see how the values on the overview page change. This is useful to examine the performance of your servers around the time that a problem occurred.
Note: Using Rewind time may be affected by how long you have opted to keep data in the Data Repository. See Purging SQL Monitor data.
To enter Back in Time mode
- Click the Rewind time button at the top right of any overview page, next to the time. If you know the server or database where there was a performance issue in the past, you should first drill down from the Global Overview page to the relevant overview page.
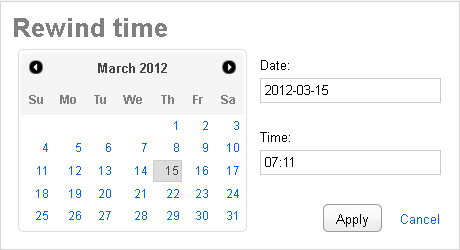
The Rewind time box is displayed, defaulted to the current date and time:
- Enter the date and time when the problem was first identified. You may want to go back five minutes earlier, so you can watch the performance as it changed.
- Click Apply.
The date and time is removed, and the page is updated at the top right to show that you are now Back in Time and no longer viewing current data:Back in Time mode is a frozen snapshot of data at the time you specified. SQL Monitor does not automatically advance the time, so the sparkline graphs and values will not move forward in time.
- Use the Back in Time bar buttons to adjust the time in increments of 1 minute, 10 minutes, 1 hour or 1 day:
- While you are in Back in Time mode, you can continue navigating through the overview pages as usual. The time remains frozen until you return to the present. For example, you can first investigate the performance of the host machine, drill down to a SQL Server instance and then to a particular database, all frozen at the same time.
- To return to normal operation, click Return to the present.
What is displayed in Back in Time mode?
- All performance metrics on the overview pages reflect the time entered in Back in Time mode; the sparkline graph shows the trend for 5 minutes leading up to this time.
Click on a sparkline graph to go the Analysis page showing a performance graph of that metric for the ten minute period before the 'frozen' time. If you then select an option from the Time range drop-down list, Back in Time mode is cancelled and the time range is relative to the current time.
- All processes and error log entries reflect the time entered.
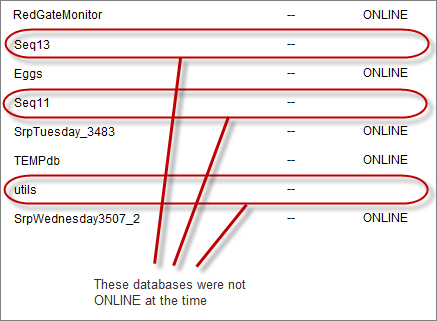
- Database availability is shown for the time entered in Back in Time mode. If the database was at any state other than ONLINE, then the Availability column is shown as blank.
Data not available in Back in Time mode
Alert summary information on the overview pages is not shown when in Back in Time mode:
- The alert summary panel at the top of the overview page is removed.
- A dash -- is shown in place of the numbers in the Uncleared alerts, Unread alerts and Last 24 hrs columns. If you click the dash, the Alert Inbox will show these alerts for the current time, not the time in the past.
- The Status column shows a dash (as the Status is determined by uncleared alerts).
What happens when I go back in time before a server was added?
Servers added recently that were not being monitored at the time you are viewing are removed from the Monitored servers list.
If you are already viewing an overview page, and rewind time to a point where the SQL Server instance or machine was not yet being monitored, then the page contains no data. Try advancing the time forward to a point where the sparkline graphs are displayed.


