How do I view component information and log files?
Published 04 December 2012
Log files collect information about SQL Monitor while you are using it. These files are useful to us if you have encountered a problem.
Viewing log files
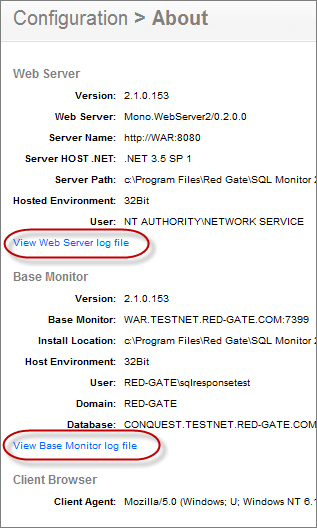
Go to the Configuration tab. Under About, select About:
The page displays useful information about the Web Server, Base Monitor and Client Browser.
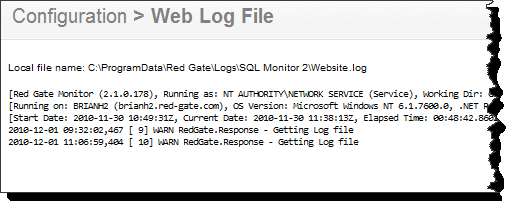
Click the View Web server log file or View Base Monitor log file links to display detailed logs of the activities for each of these SQL Monitor components.
When you click on a link to view the log file, the contents of the log file are displayed in your browser, and a link to the location of the file on the Base Monitor computer is displayed.
Should you need to contact Red Gate support, they may ask you to email log details to them. Download all log files on this page under Diagnostics: click Retrieve all log files, and attach a copy to your email. This maintains the initial log format, which can be checked more quickly and easily than reformatted content.
Viewing connection information for monitored servers
If you have connection problems when monitoring some of your servers, you can view logged connection errors:
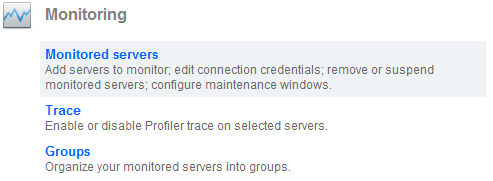
- Go to the Configuration tab and under Monitoring, select Monitored servers.
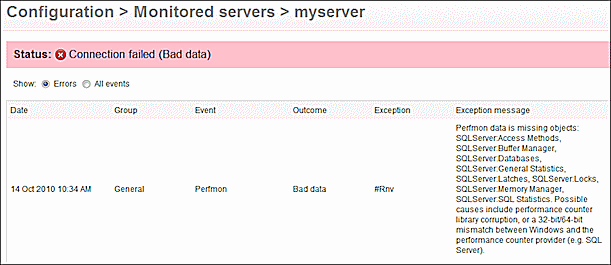
- For the server you want to check, click the inline Show log link.
- By default, only recent errors are displayed. Select All events to view all recent connection events for the selected server:


