Step 3. Create
Published 28 October 2013
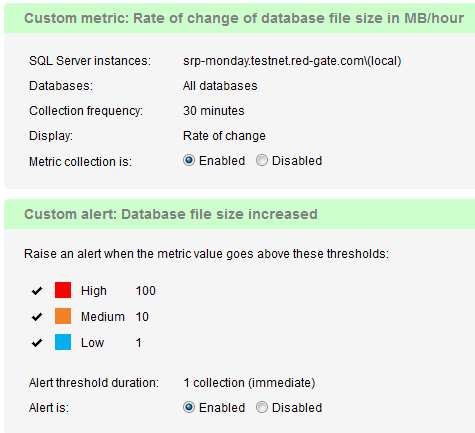
Step 3 summarizes the settings completed earlier in the wizard, and allows you to enable or disable the custom metric and alert before creating them.
If you want to change any of the earlier settings, click the Back button.
If you didn't add an alert, a confirmation message is displayed:
Click the Create metric and alert button or Create metric button. The new metric is listed on the Custom metrics page:
Once created, you may want to:
- create additional metrics and alerts. Click the Create custom metric button again to start a new wizard.
- edit existing metric and alert settings. You can enter the wizard at any time to make changes to it. See Editing existing custom metrics and alerts.
- look at the analysis graph for this metric to see collected values plotted as data points. You can also display additional metrics in the graph at the same time to identify correlations. The first collection will take place within 10 seconds of the metric being created; subsequent collections take place according to the defined metric collection frequency. See Analyzing metric data.


