Filtering alerts
Published 31 January 2017
You can filter the alerts that are displayed in the Alert Inbox in two basic ways:
- by the selection in the Monitored servers list
- by alert attributes (using system or custom filters)
These two methods of filtering the Alert Inbox always work in combination.
Persistent filtering
Filtering is persisted, so when you return to the Alert Inbox after selecting a different web page, the previous filtered list is displayed.
The Monitored servers list
The Monitored servers list controls the objects for which alerts are displayed. For example, if you select a database in the list, then only alerts relating to that database are listed.
The current object selection is reflected in the page heading:

In this example, the Alert Inbox is displaying only alerts on a selected host machine. The heading includes the full path to the selected object, showing where it is in the hierarchy of groups, machines, instances and databases.
Global filters
The Global filters are available above the Monitored servers list. They are a quick way of getting back to a sensible starting point.
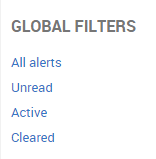
The Global filters are shortcuts that carry out two actions at once:
- Reset the Monitored servers list back to All Servers.
- Apply a system filter to the Filter drop-down list.
System filters
The Filter drop-down above the Alert Inbox contains a number of predefined filters, covering typical scenarios for filtering the Alert Inbox. For example, you can view only Low, Medium, or High level alerts, or see all Active alerts.
As soon as you select a filter, the Alert Inbox is updated.
Custom filters
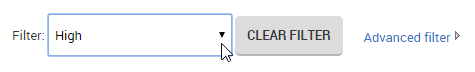
Click Advanced filter to expand the filter panel, where you can apply any combination of filter options you want.
To collapse the filter panel:
- Click Advanced filter again, or
- Click the Hide hyperlink at the bottom right corner of the panel
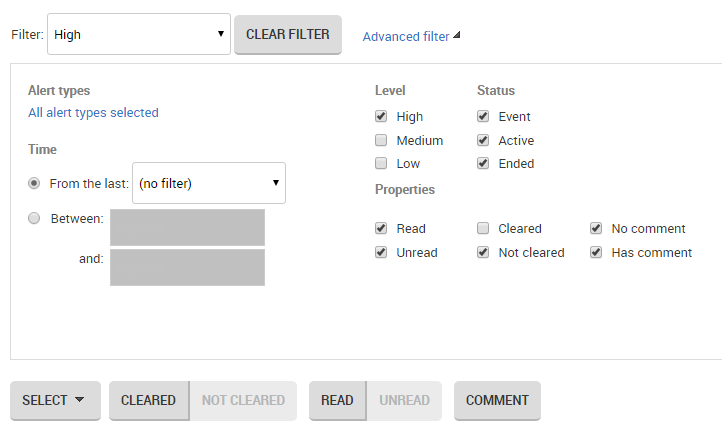
The Advanced filter panel allows you to filter alerts in a number of ways:
- By type
- By time (when the alert was raised)
- By level
- By status
- By properties
All these options work in combination. You can be very specific about which alerts you want to see, for example, High level deadlocks that are unread in the last hour, or all Active alerts with comments except Low level alerts and Job failed alerts between last night and today.
You can then save and apply these custom filters to all objects or selected objects only.
Filtering by type
Click All alert types selected. The Select alert types box is displayed:
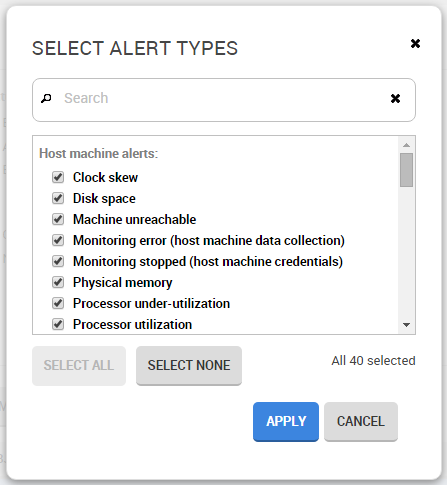
Select the checkbox for each alert type you want to show in the Alert Inbox. Use the Select none button first to clear the selection if you only want to choose one or two types to display.
If you are familiar with the alert names, type the first few characters of an alert name in the Search box. Only matching alerts are displayed. (You may need to choose Select none and then Select all if you want to select only the matching alerts.)
As soon as you click Apply, the Alert Inbox is filtered by your selection, and the Advanced filter panel is updated:
- The selected alert type is displayed (or the number of types selected, if more than one).
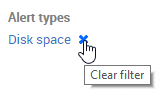
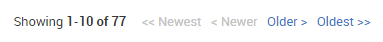
Click the x to remove the alert type filter; the link is reset to All alert types selected. - You can see how many alerts match the current filter options by looking at the Showing.... number.
Filtering by time
The time filter applies to the time each alert was raised. Under Time, select how you want to filter the alerts:
- From the last: select a fixed time period from the drop-down list
- Between x and y: click in each box to choose a date and time. You can use only one box if required, for all alerts that were raised up to a fixed point in time, or all alerts starting from a fixed point in time.
Note: Alerts will be shown that were raised in the minute matching the "End" time; for example, if you want to view alerts between 10:00 and 14:00, alerts that were raised up till 14:01 will be shown.
Click anywhere in the alert panel outside of the boxes to apply the time filter options. The number of alerts is updated instantly, and the Showing.... number changes accordingly.
Click the x to remove the time filter (reset it to "Any time").
Filtering by other properties
Choose the required checkboxes under Level, Status, and Properties to filter the Alert Inbox. As soon as you clear or select a checkbox, the list of alerts is updated accordingly to match your selection.
Why have all the alerts vanished from the list?
You can select combinations of filter options that will always result in zero matching alerts:

In this example, you are telling SQL Monitor that you don't want to see alerts that are either Read or Unread. However, all alerts must be either Read or Unread; therefore no alerts will ever match this set of options.
Similarly, you can choose both Has comment and No comment or Cleared and Not cleared. In each case, no alerts can possibly match the selection.
The Alert Inbox may also be empty because no alerts happen to match a legitimate combination of options.
Saving advanced filter options as a custom filter
When you have selected the advanced filter options you want, you can save them as a custom filter.
This allows you to quickly reapply all the filter options you have selected, without having to reselect them again each time. You can save any number of custom filters, and this may help you prioritize which alerts you investigate - Deadlocks first, followed by all High alerts except deadlocks, then all alerts within the last two hours, and so on.
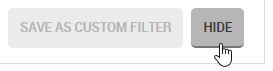
To save your filter options as a custom filter:
- Click the Save as custom filter hyperlink. The Save as custom filter box is displayed:
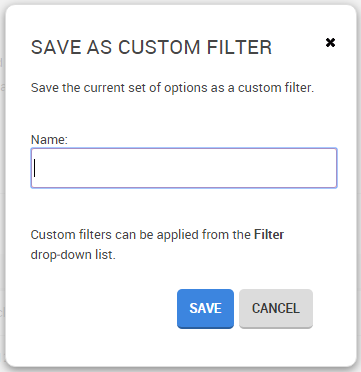
- Type a name for the custom filter. You cannot use the name of a system filter.
- Click Save. Your custom filter is now available from the Filter drop-down list:
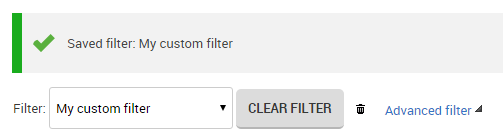
Custom filters are listed in alphabetical order below the system filters.
To delete a custom filter
- Select the filter you want to delete from the Filter list.
- Click the delete button
 .
.
The Filter list defaults back to All, but the custom filter options are persisted until you explicitly select something else.
To edit a custom filter
- Select the filter you want to edit from the Filter list.
This filter is immediately applied to the Alert Inbox. - Click Advanced filter to display the advanced filter pane, showing the saved options for this filter.
- Edit the options. The name temporarily changes to Custom * while the filter is being edited:

- Select Save as custom filter. The filter name is pre-filled in the Name box:
- To save the edited custom filter, leave the existing name and click Save.
- To create a new custom filter, enter a new name for the custom filter. The previous custom filter remains unchanged, and a new custom filter is created.
This documentation contains proprietary information and is protected by copyright law.
Copyright © 2026 Red Gate Software Limited. All rights reserved


