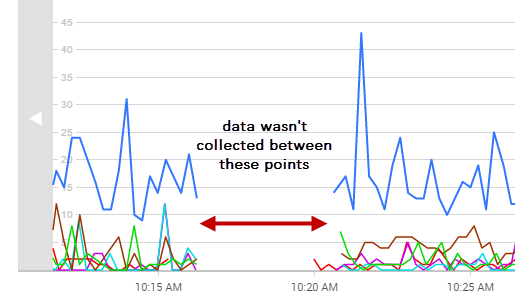
Data points missing from the Analysis Graph
Published 31 January 2017
SQL Monitor needs at least one data point to plot the graph. Data points may be missing for the time selected for the following reasons:
- data for that time range has been purged.
- the monitored object was unavailable or suspended.
- SQL Monitor was not running at that time.
- you are analyzing a custom metric measuring a rate of change, but not enough data has been collected to calculate the rate. The rate is calculated from two consecutive collection values. The first collection takes place immediately after the custom metric is created. The second collection takes place according to the defined metric collection frequency. Check the graph again when at least two collections have taken place.
Data points are also plotted differently depending on whether values are collected or calculated:
- collected values - data points represent the actual collected values. For example, Disk used simply displays the raw values provided by PerfMon. To optimize performance, some data points are not plotted if a long time range is selected.
- calculated values - SQL Monitor has to carry out its own calculation on raw data to generate a value. For example, to work out Transactions/sec, the number of transactions between data points is divided by the number of seconds between data points. This averaging has the effect of smoothing out fluctuations.
When data points are missing from the graph, there'll be a blank space instead of a line between points:


